
September 23, 2026
September 23, 2026
How Weight Loss Supplements Rank in AI Search: Brands, Buyer Intent and the Visibility Gaps
Era’s weight loss supplements report reveals a fragmented AI search landscape: alli leads the five-player visibility comparison, Optimum Nutrition tops the displayed Share of Voice list, and Thorne and Weight Watchers trade places across engines. The practical opportunity starts with identifying which conversation a brand is actually entering.
Era’s weight loss supplements report reveals a fragmented AI search landscape: alli leads the five-player visibility comparison, Optimum Nutrition tops the displayed Share of Voice list, and Thorne and Weight Watchers trade places across engines. The practical opportunity starts with identifying which conversation a brand is actually entering.
A weight loss supplement brand can compete for attention with other brands, named ingredients and medication-related entities in the same AI search landscape. A competitor list built only around similar products can miss much of that conversation. Era’s report brings together brand visibility, engine-level differences, buyer queries and cited sources. These measures answer different commercial questions: whether a brand appears, where it appears, and which information accompanies the category discussion. The result is a more useful brief than a single league table: investigate the intents where your brand belongs, the engines where its presence differs, and the evidence users encounter before they reach your website.
1. The competitive set — A supplements report that extends beyond supplement brands
The first competitive decision is deciding what counts as a competitor.
The Share of Voice list puts Optimum Nutrition at 9.5%, followed by entries including Caffeine at 4.6%, Wegovy at 3.8% and Transparent Labs at 3.4%. Phenq appears at 2.7%, alongside other entries such as Green Tea Extract, Zepbound and FDA.
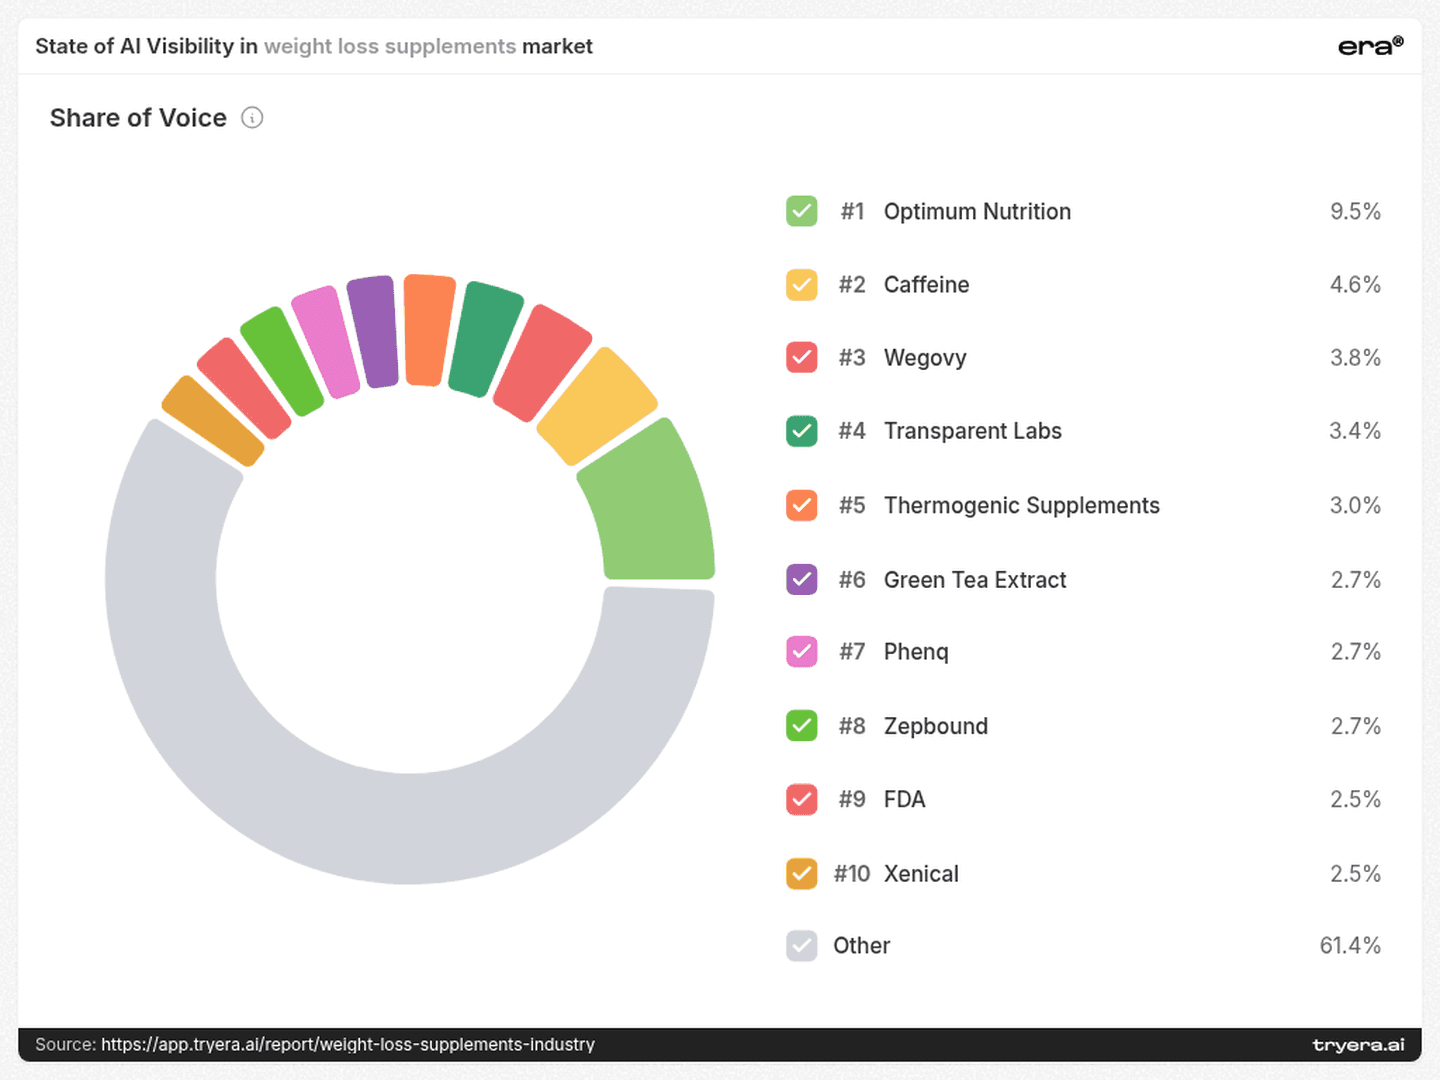
This is a mixed set of named entities, not a clean market-share ranking of supplement companies. Its value is that it exposes the breadth of the conversation: a brand may be mentioned alongside ingredients, alternative approaches and institutions, rather than only alongside comparable products.
The five-player podium answers a different question. It places alli (orlistat 60 mg) first, with 27.4% Visibility, followed on the podium by Thorne, Weight Watchers, Nature’s Way and Isagenix. Yet Weight Watchers has higher Visibility than Thorne: 5.8% versus 5.3%. The podium order should therefore not be read as a descending Visibility table.
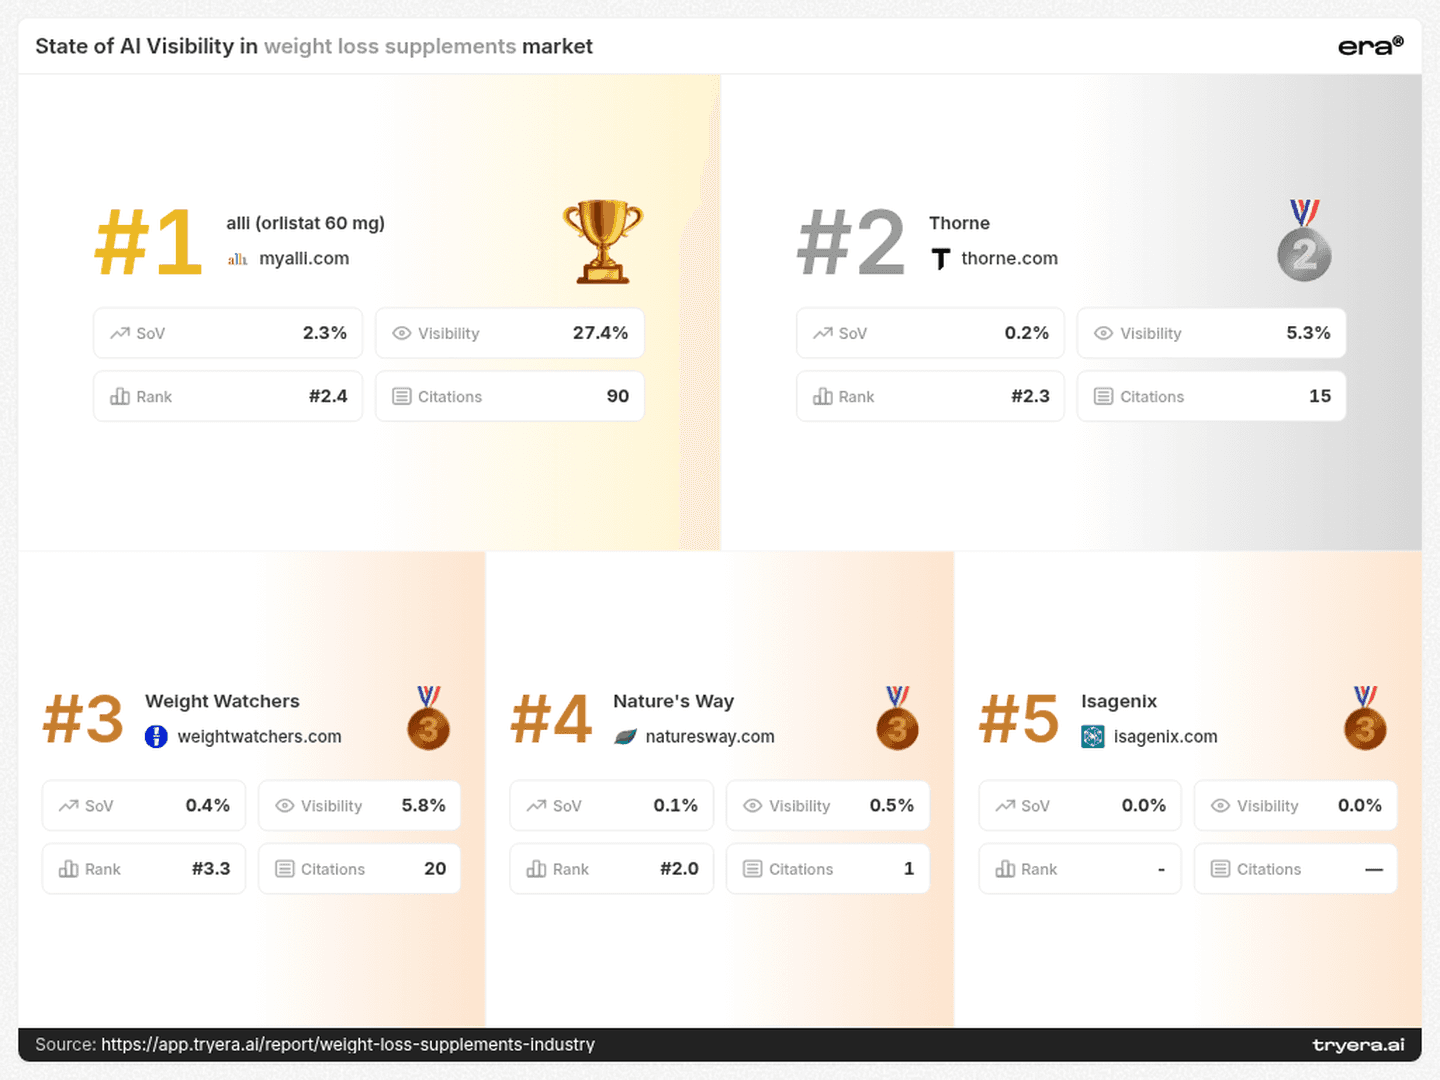
Visibility measures the share of monitored answers naming a brand. Share of Voice measures its share of tracked mentions. Neither establishes product effectiveness, a recommendation, or a sale.
For a category team, the next step is to separate direct brands, ingredients, medication-related entities and institutions in its own analysis. Then inspect the answers to distinguish a recommendation from a comparison, a caution or a passing reference.
Before asking who wins AI search, establish which conversation each metric describes.
2. Engine differences — Similar averages conceal opposite competitive positions
Thorne and Weight Watchers sit just 0.5 percentage points apart in overall Visibility. Their engine profiles are much less similar.
On ChatGPT, Thorne reaches 10.0%, compared with 2.0% for Weight Watchers. On Perplexity, the relationship reverses: Weight Watchers reaches 10.4%, while Thorne records 2.1%. Google AI shows 9.5% for Weight Watchers and 7.1% for Thorne; both record 2.0% on Claude.
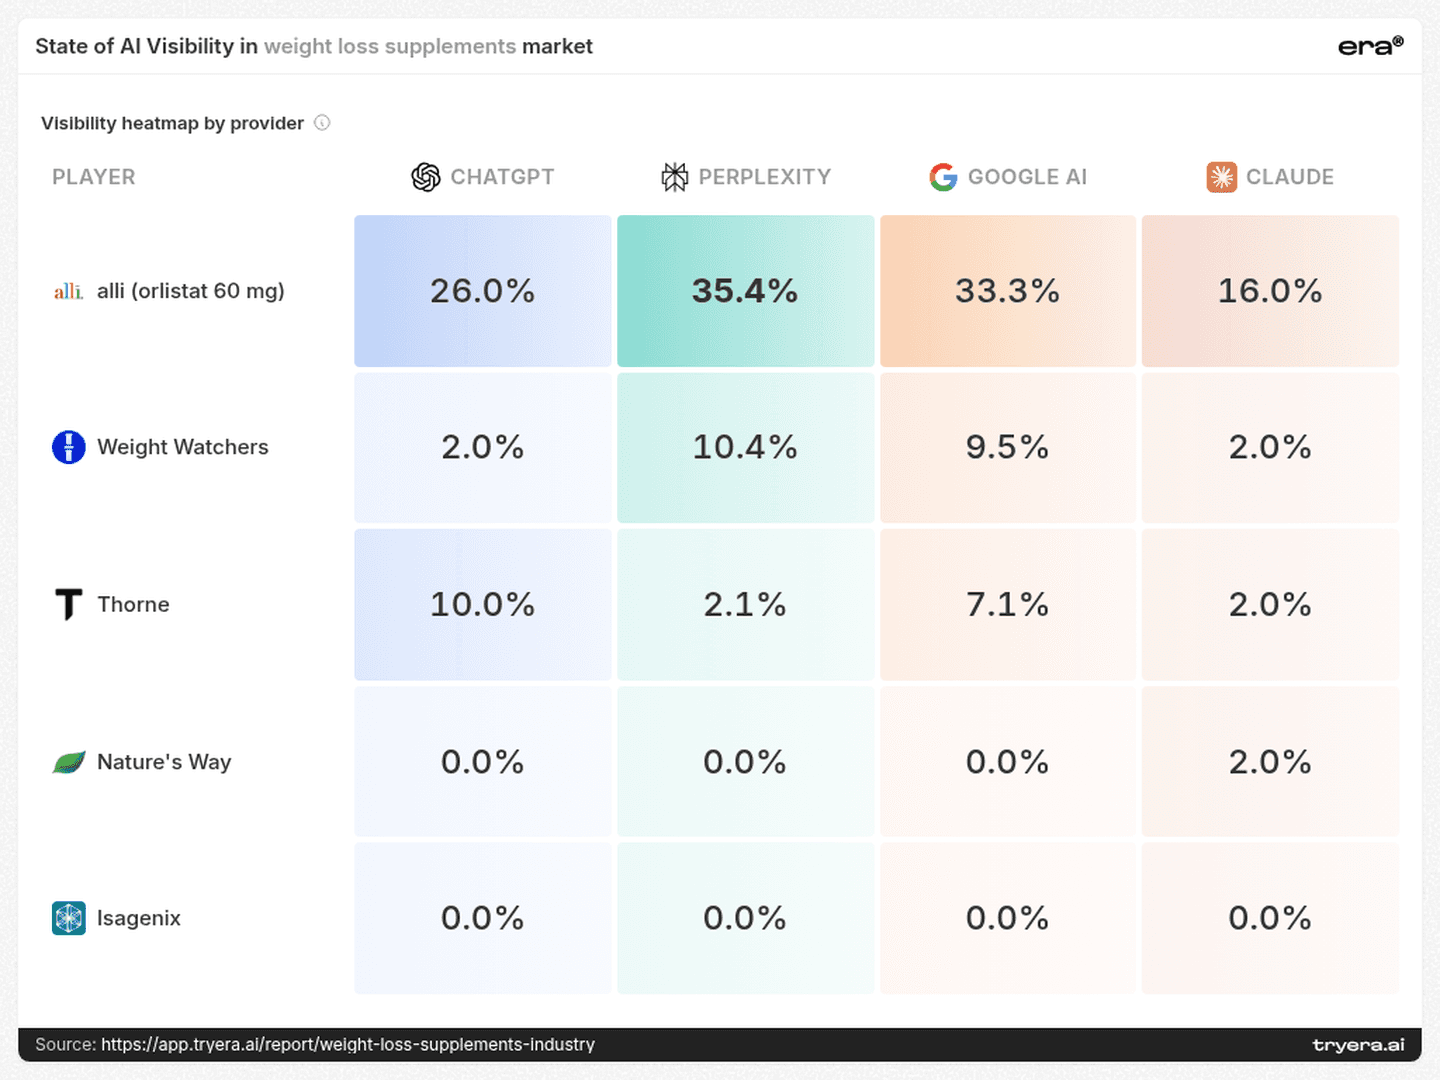
A single instruction to “improve AI visibility” would hide two different investigations. Thorne could examine the answers where its ChatGPT presence fails to carry over to Perplexity. Weight Watchers could investigate the reverse pattern, comparing the questions, source selections and roles assigned to the brand.
Even alli’s stronger presence varies substantially: 35.4% on Perplexity versus 16.0% on Claude, a 19.4-point gap. Its leading position within the five-player comparison is not uniform exposure across engines.
These are report-wide provider figures. To diagnose the difference, run matched questions across engines and compare the resulting answers; do not attribute the overall gap to a particular query without testing it.
3. Buyer intent — Four questions that require different kinds of evidence
The query table points to four distinct research briefs:
alli: “best weight loss supplements women over 40” — a demographic-specific question.
Weight Watchers: “diet pills customers actually stick with” — a question about sustained use.
Thorne: “best weight loss supplements 2026 evidence based brands” — a question about evidence and brand evaluation.
Nature’s Way: “best weight loss gummies 2026” — a format-led comparison.
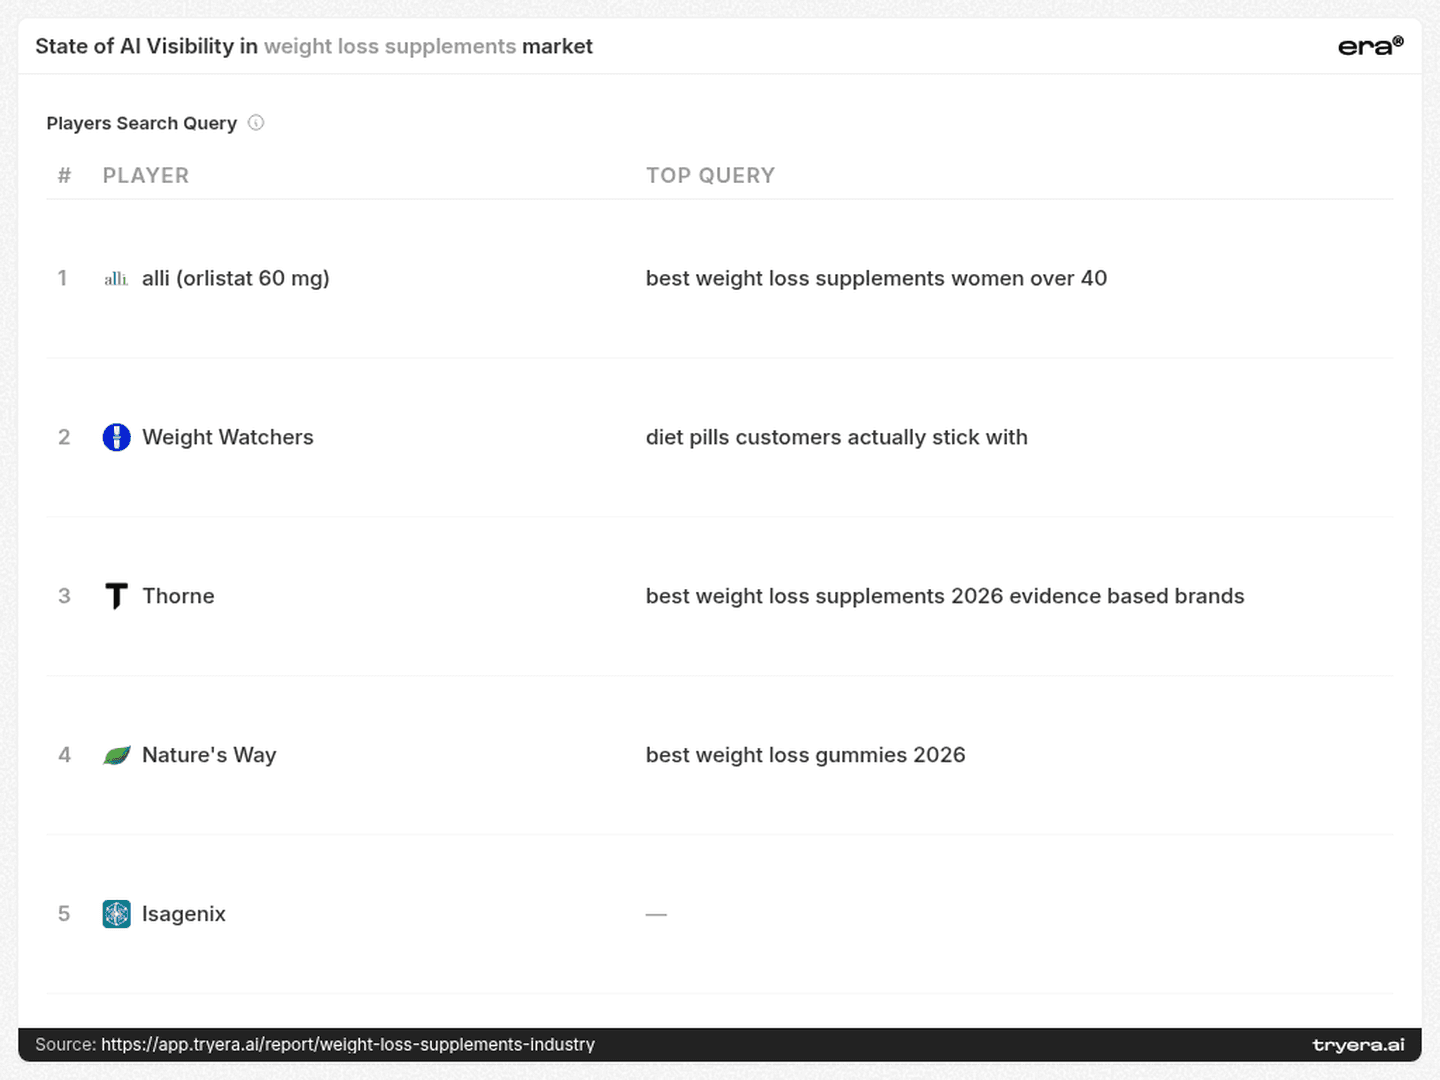
The Weight Watchers pairing deserves particular attention. The wording asks about pills and continued use; the named player is Weight Watchers. The useful investigation is how the answer connects them: as a direct option, a broader support approach, an alternative or a contextual mention.
For Thorne, the phrase “evidence based brands” suggests testing how clearly an answer distinguishes brand-level quality information from evidence relevant to a particular product. For Nature’s Way, the gummies wording makes product-format recognition worth inspecting. For alli, the demographic qualifier calls for checking whether the answer preserves the scope and limitations of the evidence it cites.
These are directions for answer review, not proof that a product meets the request. Build separate query clusters around demographic fit, sustained use, evidence and format; judge each against the information that question actually needs.
4. Sources — The leading domain is not the leading individual page
The citation-source list places fortune.com at 87, gnc.com at 78 and goodrx.com at 70 in the displayed counts. It also includes NIH domains, Healthline, Mayo Clinic, FDA and YouTube.
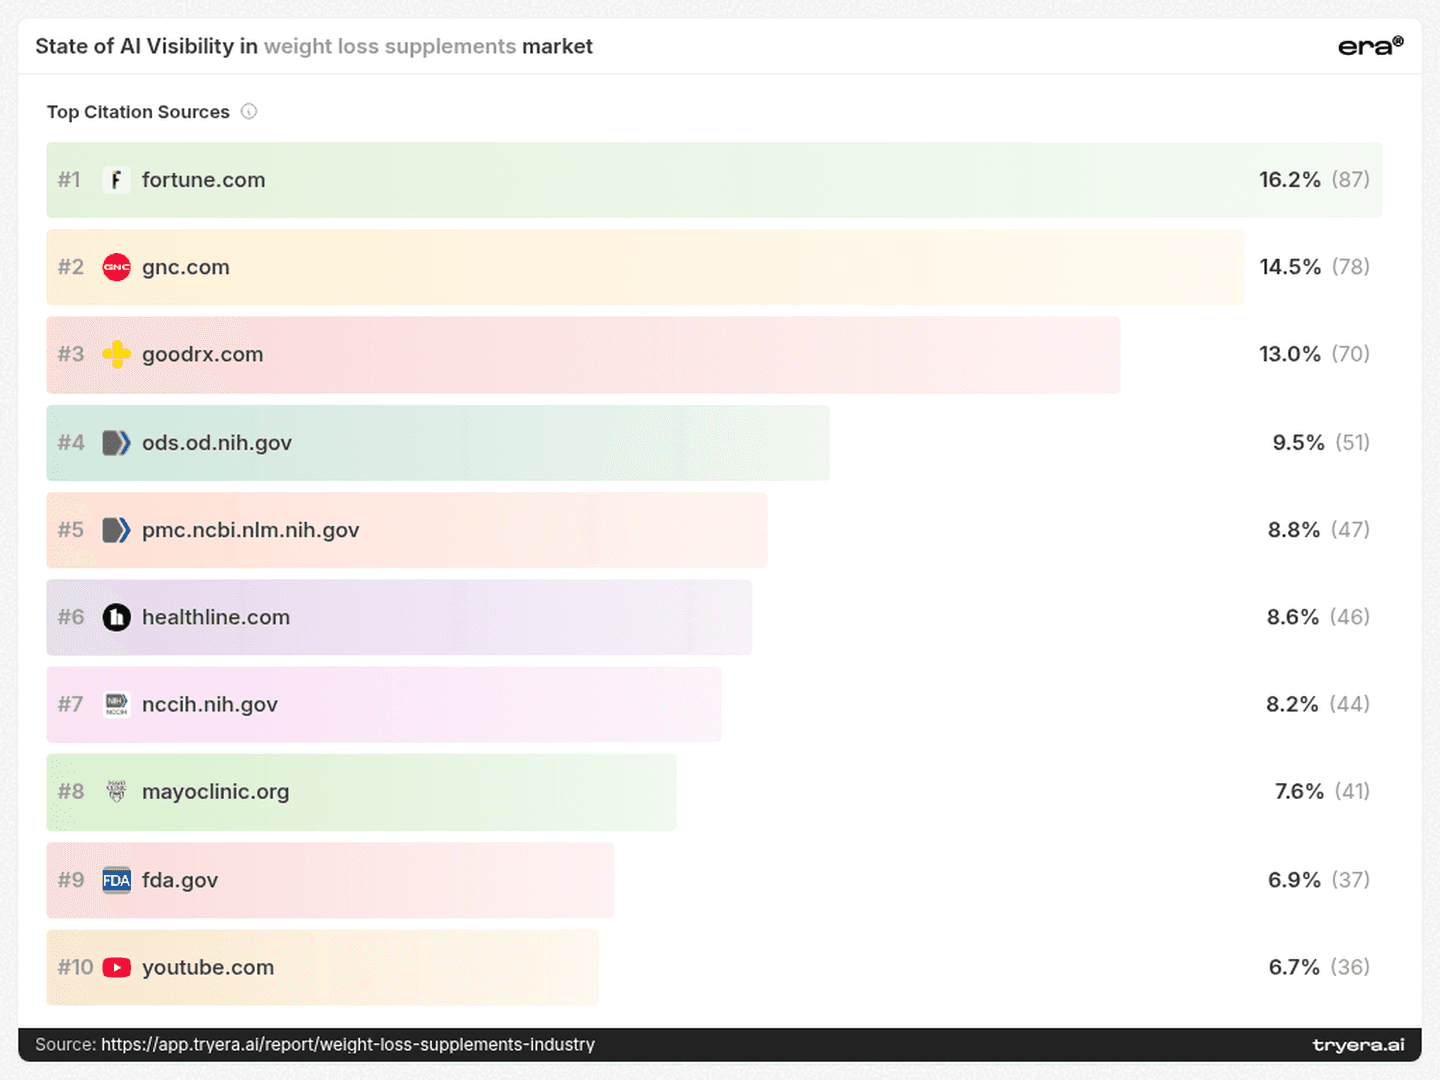
That mix suggests several source types to investigate: commercial comparisons, retail content, health information and institutional material. A brand’s source review should cover those different contexts rather than treating every citation as the same kind of endorsement.
At the individual-page level, the order changes. The GoodRx entry whose title begins “6 Weight-Loss Pills That Work: Which Is the Best?” leads with 52, ahead of Fortune’s fat-burner entry at 45. “Top Weight Loss Medications” on obesitymedicine.org records 28.
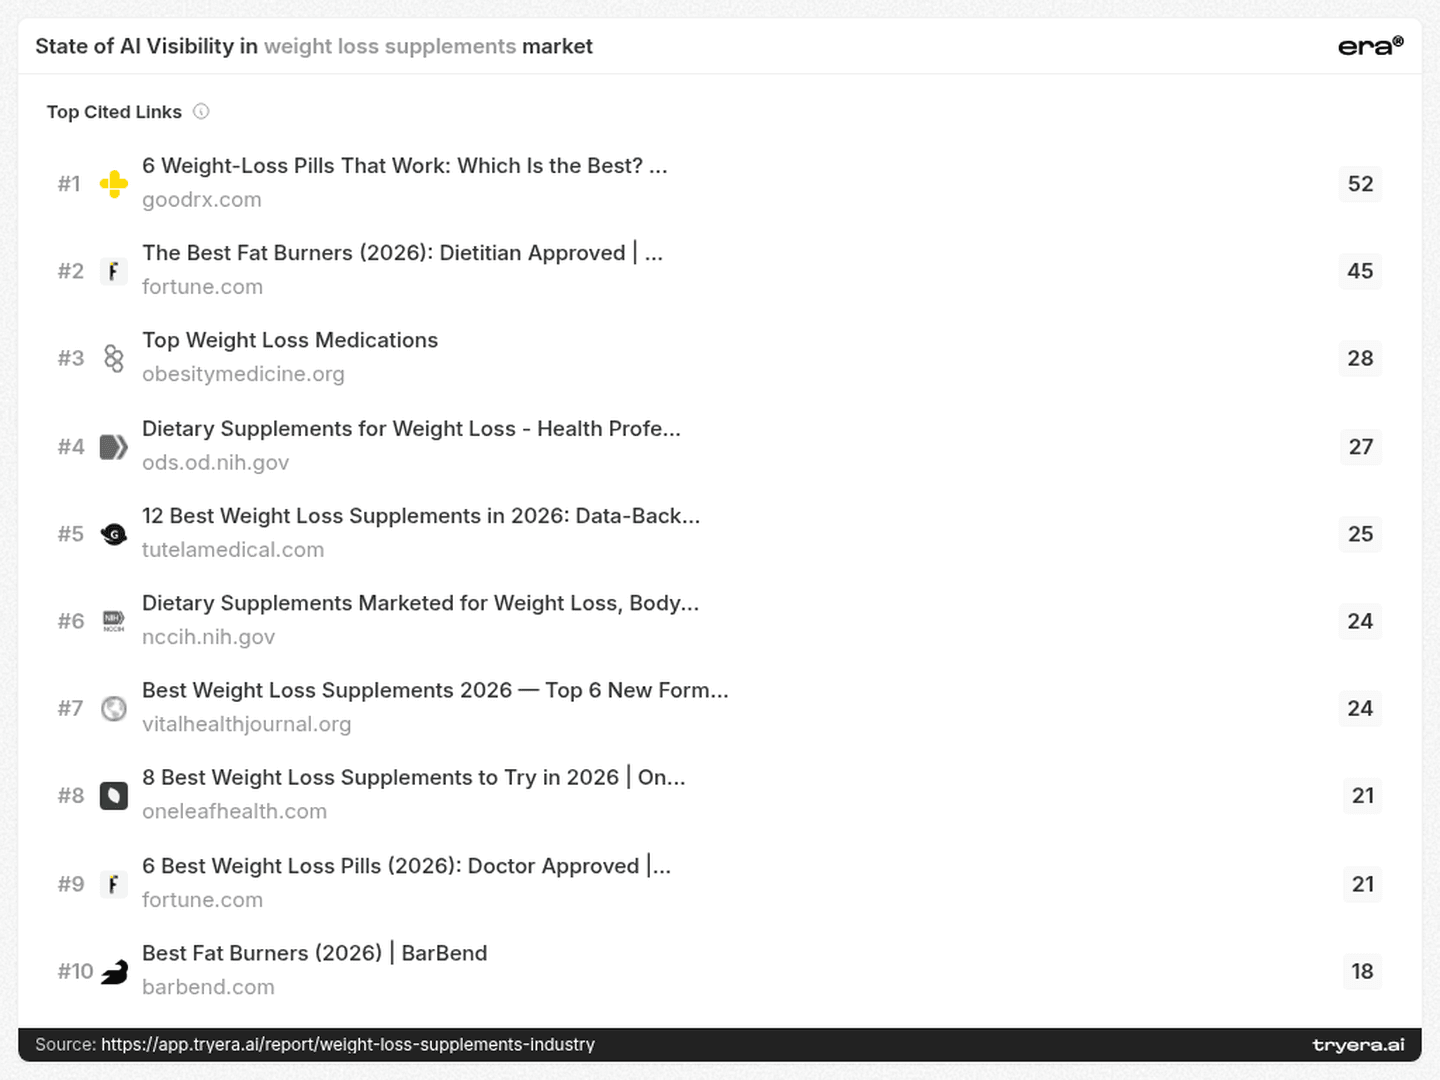
Fortune leads the displayed domain counts, while GoodRx leads the displayed page counts. This distinction matters when assigning work: “understand a publisher” is too broad if a specific comparison page is the recurring reference.
The list also includes entries from tutelamedical.com at 25, vitalhealthjournal.org at 24 and oneleafhealth.com at 21. These pages warrant inspection alongside the larger sources. Their presence is evidence of citation activity, not evidence of editorial independence or clinical authority.
For each relevant page, record what question it answers, whether your brand appears, what claims it makes and what evidence supports them. A citation count becomes useful when it identifies a concrete information gap to investigate.
5. Citation mix — Most of the cited context sits outside owned channels
The citation-mix page assigns 95.6% of alli’s mix to “Others,” alongside 2.0% owned and 2.4% social. Thorne shows 94.0% Others, 2.0% owned and 4.0% social. Weight Watchers records 89.6% Others and 10.4% owned; Nature’s Way records 90.0% Others and 10.0% owned.
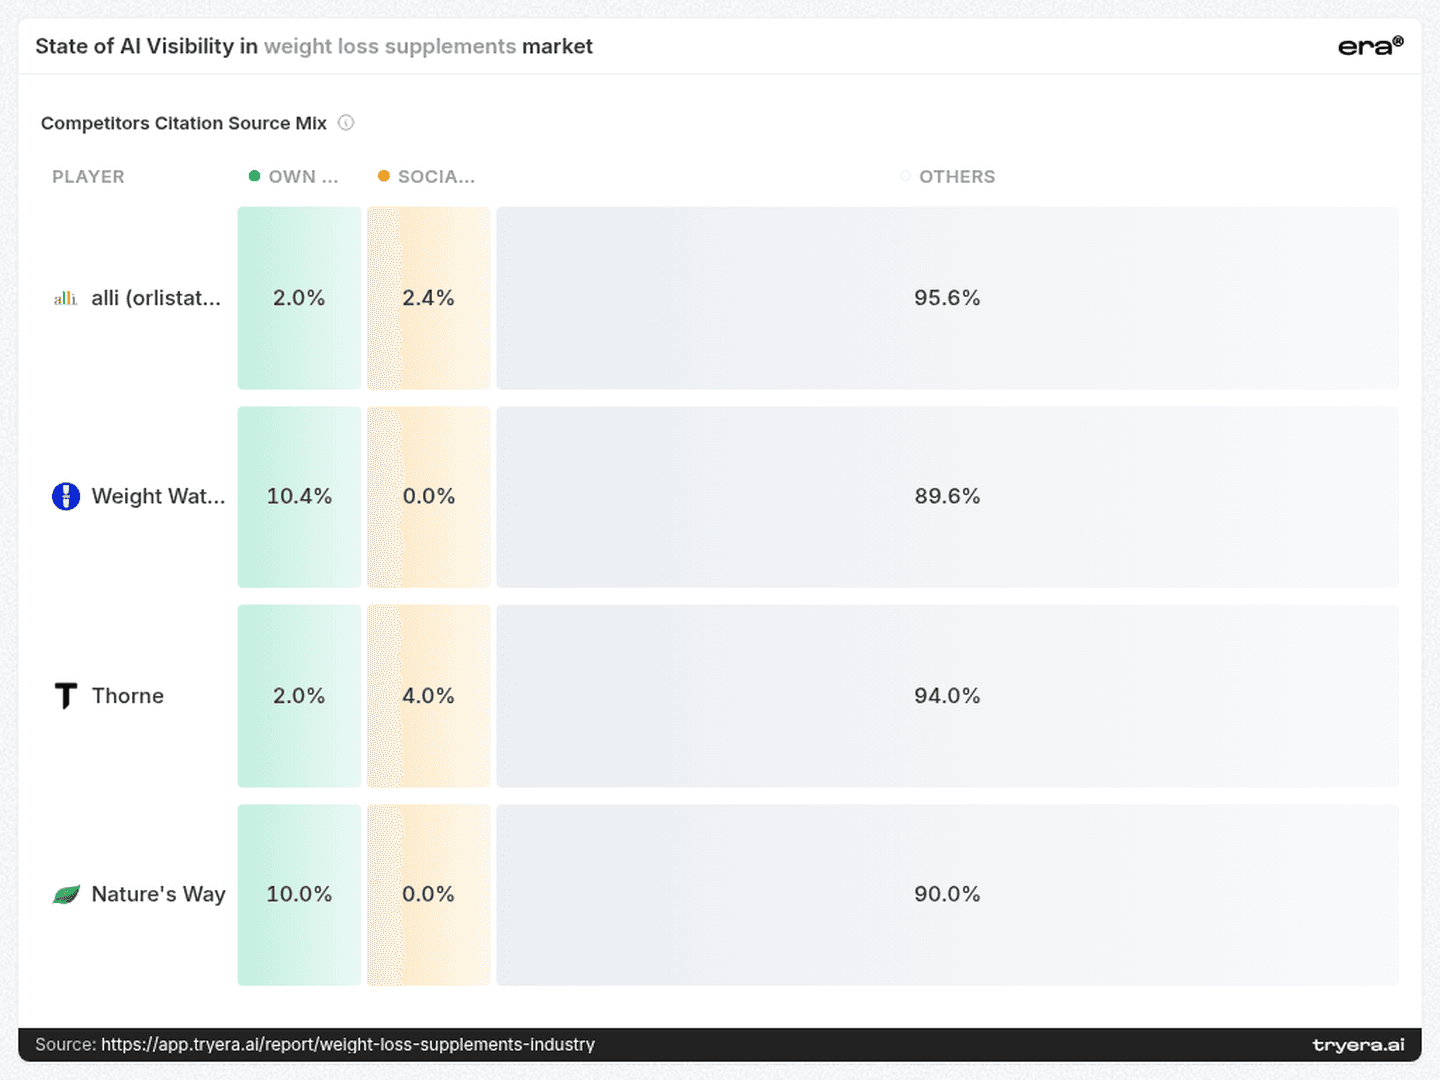
For every player shown, the largest portion is outside the owned and social buckets. An audit confined to a company’s website would therefore leave much of its reported citation context unexamined.
This calls for two connected workstreams. On owned pages, check whether product identity, evidence, limitations and comparisons are clear. In external material, inspect whether the same information is represented accurately and whether cited claims remain traceable to their evidence.
The larger owned share for Weight Watchers does not establish a larger absolute volume of owned citations. Nor does a small owned share prove that a website is ineffective. Use the mix to allocate investigative attention, then examine the underlying pages.
Improving the information on your website is one task. Understanding the information cited around your brand is another.
6. Beyond the headline — Six brands with different questions to investigate
The useful opportunities extend beyond the first podium position. Six brands illustrate why the next step should depend on the observed pattern.
Thorne and Weight Watchers: investigate the engine reversal. Thorne’s 10.0% ChatGPT Visibility and Weight Watchers’ 10.4% Perplexity Visibility identify different areas of relative strength. Each team should inspect matched answers on the weaker engine, documenting differences in sources and brand context before choosing content changes.
Nature’s Way and Isagenix: distinguish narrow presence from no observed presence. Nature’s Way registers 2.0% on Claude and 0.0% on the other three engines shown. Isagenix records 0.0% across all four. For Nature’s Way, inspect the Claude appearances first and test comparable questions elsewhere. For Isagenix, start by checking the monitored questions and brand recognition against relevant product and category language.
Nature’s Way also illustrates why average position needs a frequency check. Its podium card shows an average Rank of 2.0, alongside 0.5% Visibility and one citation. An early average appearance is not broad coverage. The first task is to understand that limited presence before treating it as a repeatable advantage.
Transparent Labs and Phenq: investigate attention outside the five-player comparison. They appear in the Share of Voice list at 3.4% and 2.7%, respectively. That gives both a concrete reason to inspect the answers generating their mentions, even though they are absent from the five-player podium.
For these two brands, the immediate question is the role of each mention: recommendation, comparison, ingredient discussion or caution. Classify those contexts before treating Share of Voice as a measure of commercially useful exposure. A focused comparison brief can then address the buyer questions where the brand is relevant and the evidence is adequate.
7. Technical priorities — Treat audit findings as a backlog to verify
The competitive-landscape page lists 50 common issues: 19 structured-data issues, 16 content-readability issues, five AI-assistant-guideline issues, four crawler-access issues, two page-discovery issues and four content-feed issues.
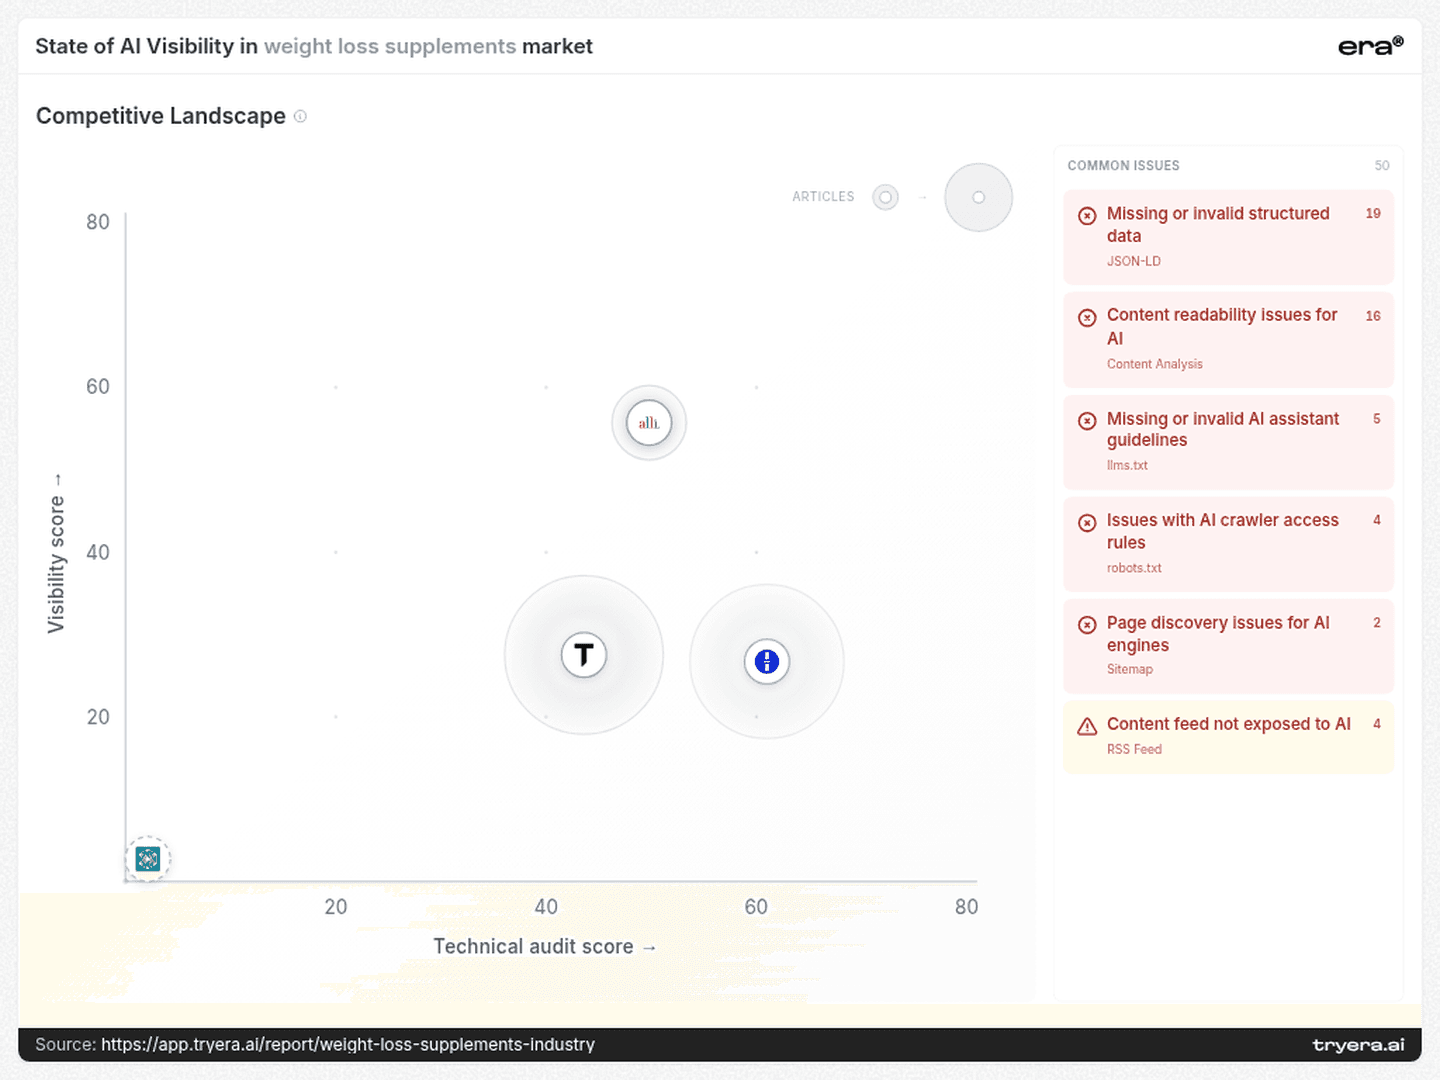
The structured-data and readability categories account for 35 of those 50 findings. They provide a starting point for a page-level review, especially where product details and supporting evidence need to be understood together.
Prioritise verified problems by their effect: can the relevant page be reached, can its main content be read, and does its structured information match what the page says? Validate the report’s other audit categories individually before making changes.
These aggregate findings should not be assigned to a particular brand or used as an explanation for its engine gap. The landscape’s Visibility score is also a separate measure from the headline Visibility percentages. A technical fix needs its own validation; subsequent answer changes need their own measurement.
8. The next 90 days — Turn the differences into testable work
Days 1–30: establish the right comparison.
Separate brands, ingredients, medication-related entities and institutions in the tracked set. Review brand-name variants without combining overlapping observations. Build a matched test set around the four observed intent clusters: demographic fit, sustained use, evidence and format. Capture answers across ChatGPT, Perplexity, Google AI and Claude, recording whether each brand is recommended, compared, cautioned about or simply mentioned.
Days 31–60: inspect the evidence and repair verified gaps.
Review the specific cited pages behind relevant answers, including comparison pages and institutional sources. For Thorne and Weight Watchers, prioritise the opposing ChatGPT–Perplexity patterns. For Nature’s Way, trace the Claude appearances. For Transparent Labs and Phenq, classify the contexts behind their Share of Voice. Use those findings to improve relevant owned information and correct demonstrable inaccuracies. Verify page-level access, readability and structured-data problems before fixing them.
Days 61–90: rerun the comparison and evaluate context.
Repeat the matched questions with a recorded date and consistent setup. Compare Visibility, average position, source selection and recommendation context separately. Check whether changes recur across questions and engines; keep isolated movements separate from repeatable patterns. Choose the next work cycle from the remaining evidence gaps, rather than from a single aggregate score.
The goal is a defensible answer to three questions: where does the brand appear, in what role, and with which evidence?
Want this scoreboard for your own brand? Run a free audit at tryera.ai/free-report — 30 minutes, your numbers, no deck required.
Full report with source data: Weight loss supplements.



A weight loss supplement brand can compete for attention with other brands, named ingredients and medication-related entities in the same AI search landscape. A competitor list built only around similar products can miss much of that conversation. Era’s report brings together brand visibility, engine-level differences, buyer queries and cited sources. These measures answer different commercial questions: whether a brand appears, where it appears, and which information accompanies the category discussion. The result is a more useful brief than a single league table: investigate the intents where your brand belongs, the engines where its presence differs, and the evidence users encounter before they reach your website.
1. The competitive set — A supplements report that extends beyond supplement brands
The first competitive decision is deciding what counts as a competitor.
The Share of Voice list puts Optimum Nutrition at 9.5%, followed by entries including Caffeine at 4.6%, Wegovy at 3.8% and Transparent Labs at 3.4%. Phenq appears at 2.7%, alongside other entries such as Green Tea Extract, Zepbound and FDA.
This is a mixed set of named entities, not a clean market-share ranking of supplement companies. Its value is that it exposes the breadth of the conversation: a brand may be mentioned alongside ingredients, alternative approaches and institutions, rather than only alongside comparable products.
The five-player podium answers a different question. It places alli (orlistat 60 mg) first, with 27.4% Visibility, followed on the podium by Thorne, Weight Watchers, Nature’s Way and Isagenix. Yet Weight Watchers has higher Visibility than Thorne: 5.8% versus 5.3%. The podium order should therefore not be read as a descending Visibility table.
Visibility measures the share of monitored answers naming a brand. Share of Voice measures its share of tracked mentions. Neither establishes product effectiveness, a recommendation, or a sale.
For a category team, the next step is to separate direct brands, ingredients, medication-related entities and institutions in its own analysis. Then inspect the answers to distinguish a recommendation from a comparison, a caution or a passing reference.
Before asking who wins AI search, establish which conversation each metric describes.
2. Engine differences — Similar averages conceal opposite competitive positions
Thorne and Weight Watchers sit just 0.5 percentage points apart in overall Visibility. Their engine profiles are much less similar.
On ChatGPT, Thorne reaches 10.0%, compared with 2.0% for Weight Watchers. On Perplexity, the relationship reverses: Weight Watchers reaches 10.4%, while Thorne records 2.1%. Google AI shows 9.5% for Weight Watchers and 7.1% for Thorne; both record 2.0% on Claude.
A single instruction to “improve AI visibility” would hide two different investigations. Thorne could examine the answers where its ChatGPT presence fails to carry over to Perplexity. Weight Watchers could investigate the reverse pattern, comparing the questions, source selections and roles assigned to the brand.
Even alli’s stronger presence varies substantially: 35.4% on Perplexity versus 16.0% on Claude, a 19.4-point gap. Its leading position within the five-player comparison is not uniform exposure across engines.
These are report-wide provider figures. To diagnose the difference, run matched questions across engines and compare the resulting answers; do not attribute the overall gap to a particular query without testing it.
3. Buyer intent — Four questions that require different kinds of evidence
The query table points to four distinct research briefs:
alli: “best weight loss supplements women over 40” — a demographic-specific question.
Weight Watchers: “diet pills customers actually stick with” — a question about sustained use.
Thorne: “best weight loss supplements 2026 evidence based brands” — a question about evidence and brand evaluation.
Nature’s Way: “best weight loss gummies 2026” — a format-led comparison.
The Weight Watchers pairing deserves particular attention. The wording asks about pills and continued use; the named player is Weight Watchers. The useful investigation is how the answer connects them: as a direct option, a broader support approach, an alternative or a contextual mention.
For Thorne, the phrase “evidence based brands” suggests testing how clearly an answer distinguishes brand-level quality information from evidence relevant to a particular product. For Nature’s Way, the gummies wording makes product-format recognition worth inspecting. For alli, the demographic qualifier calls for checking whether the answer preserves the scope and limitations of the evidence it cites.
These are directions for answer review, not proof that a product meets the request. Build separate query clusters around demographic fit, sustained use, evidence and format; judge each against the information that question actually needs.
4. Sources — The leading domain is not the leading individual page
The citation-source list places fortune.com at 87, gnc.com at 78 and goodrx.com at 70 in the displayed counts. It also includes NIH domains, Healthline, Mayo Clinic, FDA and YouTube.
That mix suggests several source types to investigate: commercial comparisons, retail content, health information and institutional material. A brand’s source review should cover those different contexts rather than treating every citation as the same kind of endorsement.
At the individual-page level, the order changes. The GoodRx entry whose title begins “6 Weight-Loss Pills That Work: Which Is the Best?” leads with 52, ahead of Fortune’s fat-burner entry at 45. “Top Weight Loss Medications” on obesitymedicine.org records 28.
Fortune leads the displayed domain counts, while GoodRx leads the displayed page counts. This distinction matters when assigning work: “understand a publisher” is too broad if a specific comparison page is the recurring reference.
The list also includes entries from tutelamedical.com at 25, vitalhealthjournal.org at 24 and oneleafhealth.com at 21. These pages warrant inspection alongside the larger sources. Their presence is evidence of citation activity, not evidence of editorial independence or clinical authority.
For each relevant page, record what question it answers, whether your brand appears, what claims it makes and what evidence supports them. A citation count becomes useful when it identifies a concrete information gap to investigate.
5. Citation mix — Most of the cited context sits outside owned channels
The citation-mix page assigns 95.6% of alli’s mix to “Others,” alongside 2.0% owned and 2.4% social. Thorne shows 94.0% Others, 2.0% owned and 4.0% social. Weight Watchers records 89.6% Others and 10.4% owned; Nature’s Way records 90.0% Others and 10.0% owned.
For every player shown, the largest portion is outside the owned and social buckets. An audit confined to a company’s website would therefore leave much of its reported citation context unexamined.
This calls for two connected workstreams. On owned pages, check whether product identity, evidence, limitations and comparisons are clear. In external material, inspect whether the same information is represented accurately and whether cited claims remain traceable to their evidence.
The larger owned share for Weight Watchers does not establish a larger absolute volume of owned citations. Nor does a small owned share prove that a website is ineffective. Use the mix to allocate investigative attention, then examine the underlying pages.
Improving the information on your website is one task. Understanding the information cited around your brand is another.
6. Beyond the headline — Six brands with different questions to investigate
The useful opportunities extend beyond the first podium position. Six brands illustrate why the next step should depend on the observed pattern.
Thorne and Weight Watchers: investigate the engine reversal. Thorne’s 10.0% ChatGPT Visibility and Weight Watchers’ 10.4% Perplexity Visibility identify different areas of relative strength. Each team should inspect matched answers on the weaker engine, documenting differences in sources and brand context before choosing content changes.
Nature’s Way and Isagenix: distinguish narrow presence from no observed presence. Nature’s Way registers 2.0% on Claude and 0.0% on the other three engines shown. Isagenix records 0.0% across all four. For Nature’s Way, inspect the Claude appearances first and test comparable questions elsewhere. For Isagenix, start by checking the monitored questions and brand recognition against relevant product and category language.
Nature’s Way also illustrates why average position needs a frequency check. Its podium card shows an average Rank of 2.0, alongside 0.5% Visibility and one citation. An early average appearance is not broad coverage. The first task is to understand that limited presence before treating it as a repeatable advantage.
Transparent Labs and Phenq: investigate attention outside the five-player comparison. They appear in the Share of Voice list at 3.4% and 2.7%, respectively. That gives both a concrete reason to inspect the answers generating their mentions, even though they are absent from the five-player podium.
For these two brands, the immediate question is the role of each mention: recommendation, comparison, ingredient discussion or caution. Classify those contexts before treating Share of Voice as a measure of commercially useful exposure. A focused comparison brief can then address the buyer questions where the brand is relevant and the evidence is adequate.
7. Technical priorities — Treat audit findings as a backlog to verify
The competitive-landscape page lists 50 common issues: 19 structured-data issues, 16 content-readability issues, five AI-assistant-guideline issues, four crawler-access issues, two page-discovery issues and four content-feed issues.
The structured-data and readability categories account for 35 of those 50 findings. They provide a starting point for a page-level review, especially where product details and supporting evidence need to be understood together.
Prioritise verified problems by their effect: can the relevant page be reached, can its main content be read, and does its structured information match what the page says? Validate the report’s other audit categories individually before making changes.
These aggregate findings should not be assigned to a particular brand or used as an explanation for its engine gap. The landscape’s Visibility score is also a separate measure from the headline Visibility percentages. A technical fix needs its own validation; subsequent answer changes need their own measurement.
8. The next 90 days — Turn the differences into testable work
Days 1–30: establish the right comparison.
Separate brands, ingredients, medication-related entities and institutions in the tracked set. Review brand-name variants without combining overlapping observations. Build a matched test set around the four observed intent clusters: demographic fit, sustained use, evidence and format. Capture answers across ChatGPT, Perplexity, Google AI and Claude, recording whether each brand is recommended, compared, cautioned about or simply mentioned.
Days 31–60: inspect the evidence and repair verified gaps.
Review the specific cited pages behind relevant answers, including comparison pages and institutional sources. For Thorne and Weight Watchers, prioritise the opposing ChatGPT–Perplexity patterns. For Nature’s Way, trace the Claude appearances. For Transparent Labs and Phenq, classify the contexts behind their Share of Voice. Use those findings to improve relevant owned information and correct demonstrable inaccuracies. Verify page-level access, readability and structured-data problems before fixing them.
Days 61–90: rerun the comparison and evaluate context.
Repeat the matched questions with a recorded date and consistent setup. Compare Visibility, average position, source selection and recommendation context separately. Check whether changes recur across questions and engines; keep isolated movements separate from repeatable patterns. Choose the next work cycle from the remaining evidence gaps, rather than from a single aggregate score.
The goal is a defensible answer to three questions: where does the brand appear, in what role, and with which evidence?
Want this scoreboard for your own brand? Run a free audit at tryera.ai/free-report — 30 minutes, your numbers, no deck required.
Full report with source data: Weight loss supplements.