August 27, 2026
August 27, 2026
The State of GEO/AEO for Prediction Markets: Who Dominates AI Search and What You Can Copy
Polymarket and Kalshi are nearly universal across four engines. Below them, visibility fractures—and third-party comparison pages decide who gets a chance to enter.
Polymarket and Kalshi are nearly universal across four engines. Below them, visibility fractures—and third-party comparison pages decide who gets a chance to enter.
At first glance, this is a two-company market. Polymarket and Kalshi appear in roughly 86% of the monitored answers, while the next company on the podium is below 34%. That looks like a durable lead. The deeper pages complicate it. CFTC appears among the leading Share-of-Voice entities. Sports and betting publishers dominate the cited-source tables. Manifold Markets falls from 68% visibility on ChatGPT to 6% on Claude, while OG.com moves from 0% on ChatGPT to 52% on Claude. The category is stable only at the very top. That changes the strategic question. A prediction-market company is not competing for one universal ranking. It is competing to become the supported answer for a specific intent, inside a specific engine, using evidence that often lives on someone else’s URL.
The leaders are separated by decimals. The rest of the market is separated by systems.
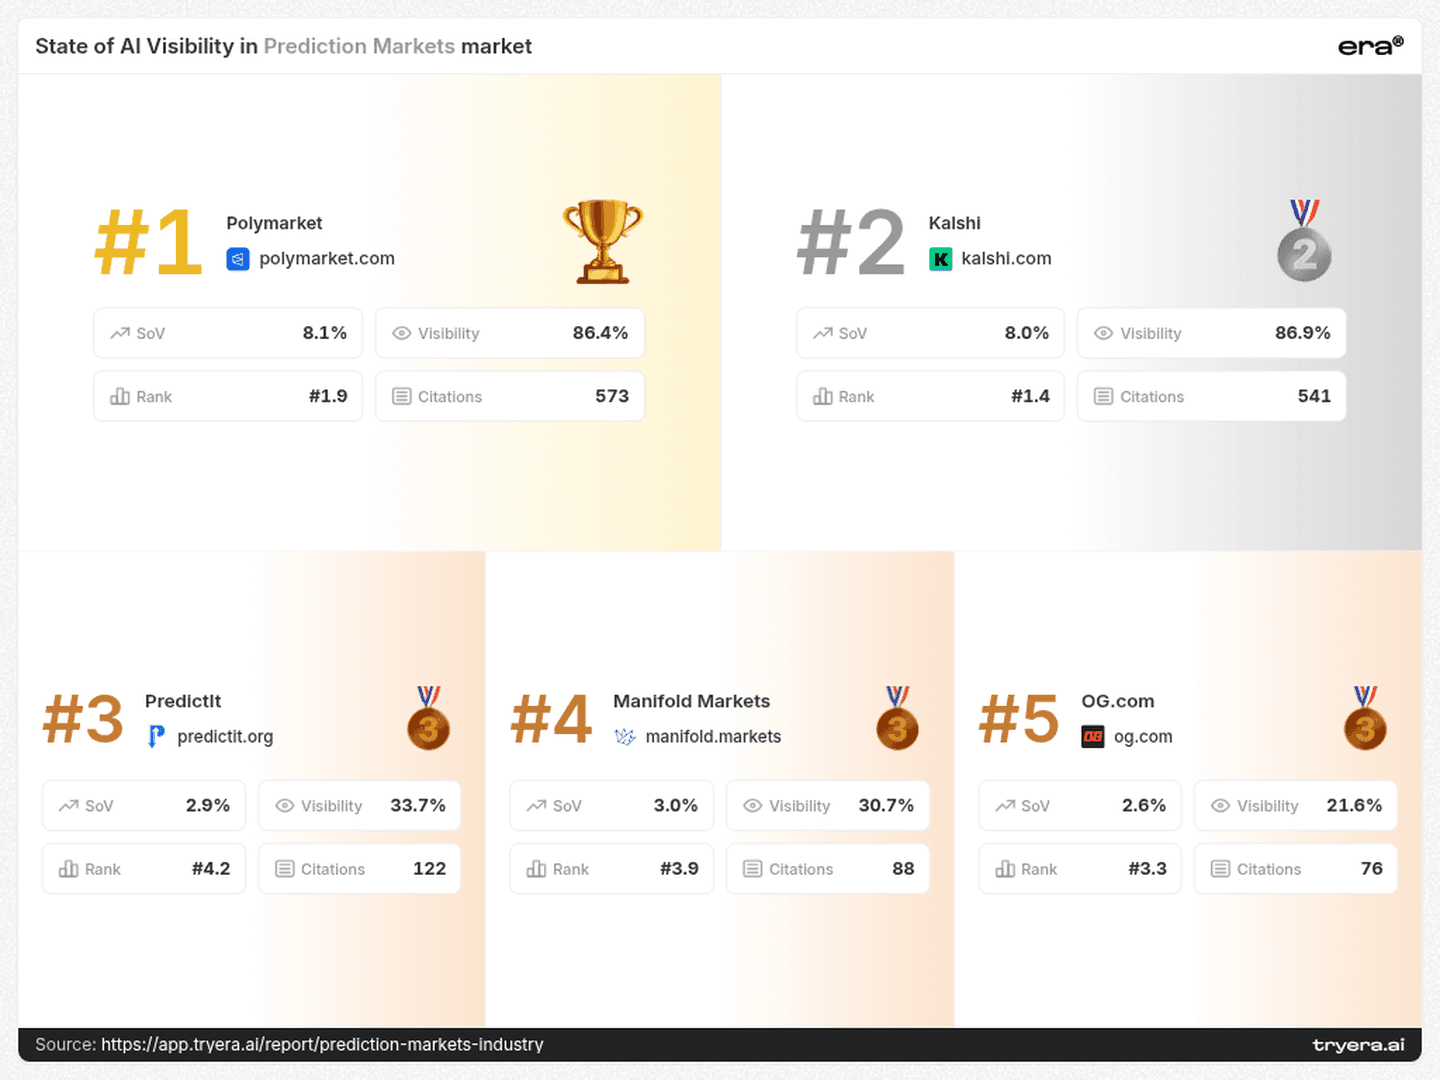
Polymarket is shown at number one with 8.1% Share of Voice, 86.4% visibility, a reported rank of 1.9 and 573 citations. Kalshi follows with 8.0% Share of Voice, 86.9% visibility, rank 1.4 and 541 citations.
There is no single winner hiding inside those numbers. Polymarket has the larger displayed citation footprint and a fractional Share-of-Voice lead. Kalshi enters slightly more answers and is reported earlier when it appears. Leadership changes with the metric being optimized.
The important gap is not the half-point between the leaders. It is the stability gap between them and everyone else. The next question is therefore not “Who is number one?” It is “What makes the top two survive every retrieval environment while challengers disappear from some of them?”
01 / Stability premium
The real lead is not 86%. It is the absence of a weak engine.
The leaders have resilience; the challengers have peaks
A high average can be assembled from one strong engine and one near-disappearance. The top two do not pay that penalty.
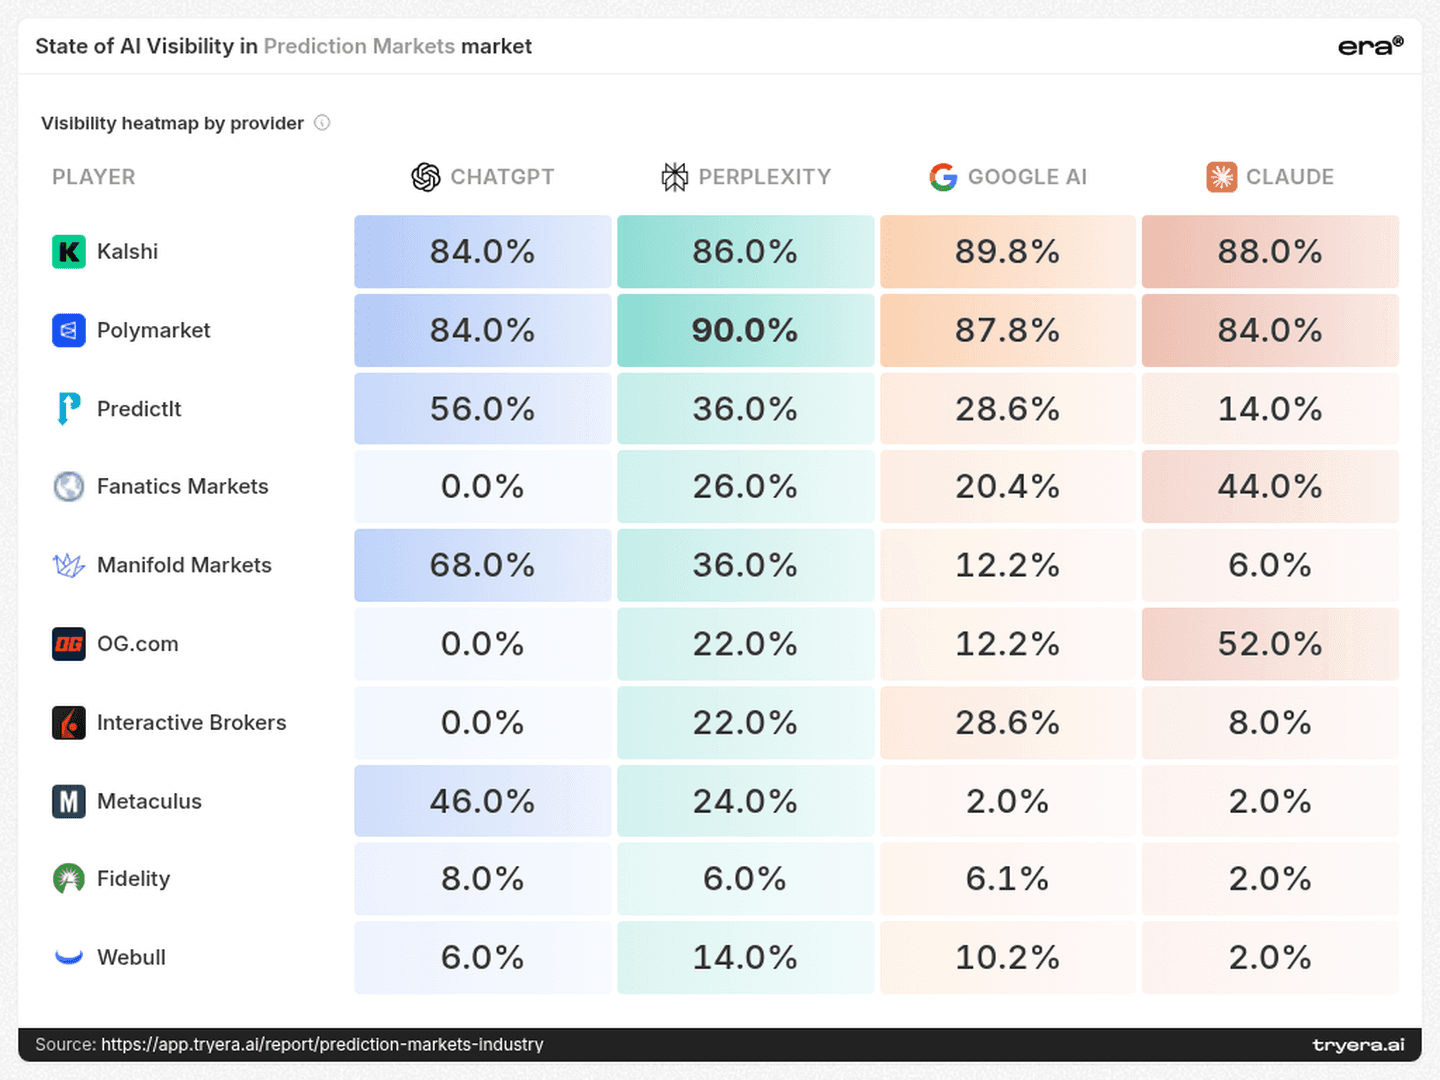
Polymarket: 84%–90% across the four providers
Kalshi: 84%–89.8% across the four providers
Manifold Markets: 68% on ChatGPT → 6% on Claude
OG.com: 0% on ChatGPT → 52% on Claude
Fanatics Markets: 0% on ChatGPT → 44% on Claude
Polymarket ranges from 84% visibility on ChatGPT and Claude to 90% on Perplexity. Kalshi ranges from 84% on ChatGPT to 89.8% on Google AI. Their provider spread is six points or less.
The challenger profiles are different. Manifold Markets spans 68% on ChatGPT and 6% on Claude. OG.com spans 0% on ChatGPT and 52% on Claude. Fanatics Markets moves from 0% on ChatGPT to 44% on Claude. Metaculus reaches 46% on ChatGPT and only 2% on Google AI and Claude.
Provider stability is a competitive advantage in its own right. The leaders are not simply strong on average; they avoid the engine-specific collapse visible across the challenger set.
02 / Engine-native challengers
Below the top two, “more visible” and “better positioned” describe different companies.
There are two challenger problems, not one
Some brands appear in too few answers. Others appear more often but enter later.
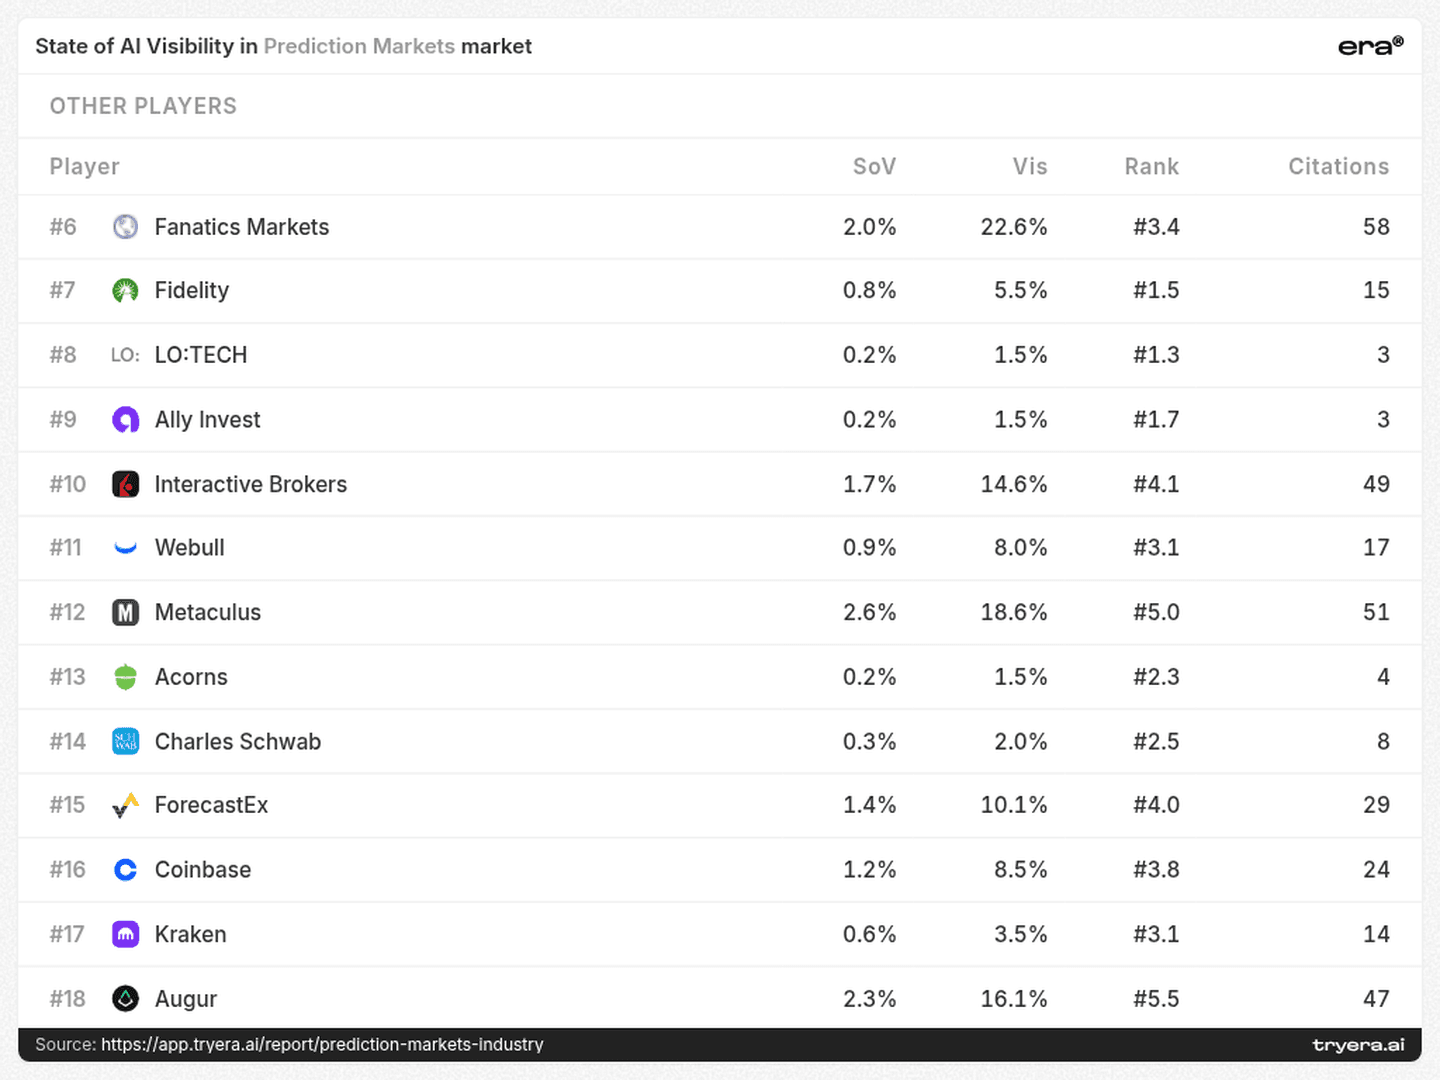
Fidelity has 5.5% visibility and a reported rank of 1.5. LO:TECH has only 1.5% visibility and rank 1.3. Both are almost absent from the category, but strong when they are selected.
Metaculus has 18.6% visibility with rank 5.0. Augur has 16.1% visibility with rank 5.5. They reach more answers than Fidelity or LO:TECH, but enter much later.
That creates two distinct challenger profiles. Fidelity and LO:TECH have limited reach but strong reported positions when present; Metaculus and Augur reach more answers but appear substantially later.
03 / Category leakage
The prompt set turns brokers, regulators and data products into competitors.
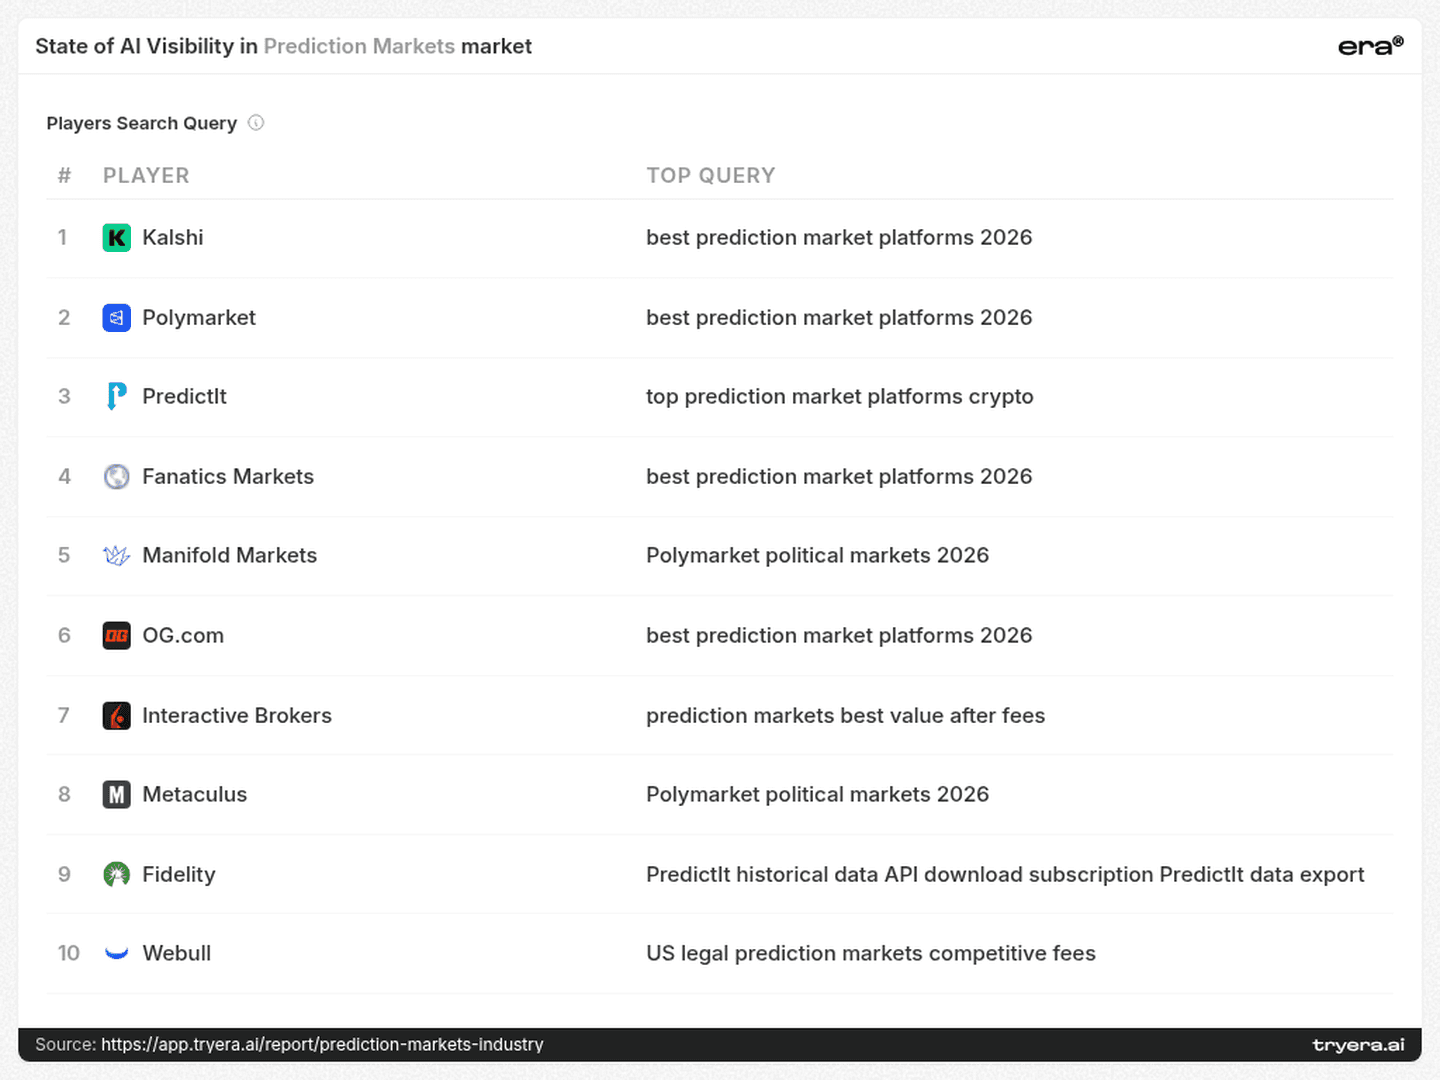
The query decides who counts as a prediction-market competitor
Comparison, crypto, politics, fees, legal access and data export create different competitive sets.
“best prediction market platforms 2026”
“top prediction market platforms crypto”
“Polymarket political markets 2026”
“prediction markets best value after fees”
“US legal prediction markets competitive fees”
“PredictIt historical data API download subscription PredictIt data export”
Four players have “best prediction market platforms 2026” as their displayed top query. PredictIt peaks on “top prediction market platforms crypto.” Interactive Brokers peaks on “prediction markets best value after fees.” Webull peaks on “US legal prediction markets competitive fees.” Fidelity is tied to a PredictIt historical-data and export query.
Two community forecasting products—Manifold Markets and Metaculus—surface around “Polymarket political markets 2026.” Competitor-branded intent is therefore an entry surface: a company can enter the answer by helping the model resolve a question centered on a rival.
This is why a generic “prediction market platform” page is strategically incomplete. The answer set reorganizes around the buyer’s task, and that task can pull in a broker, a forecasting community, a data workflow or a regulatory entity.
04 / Unpriced field
Eight percent can lead when the category boundary keeps moving.
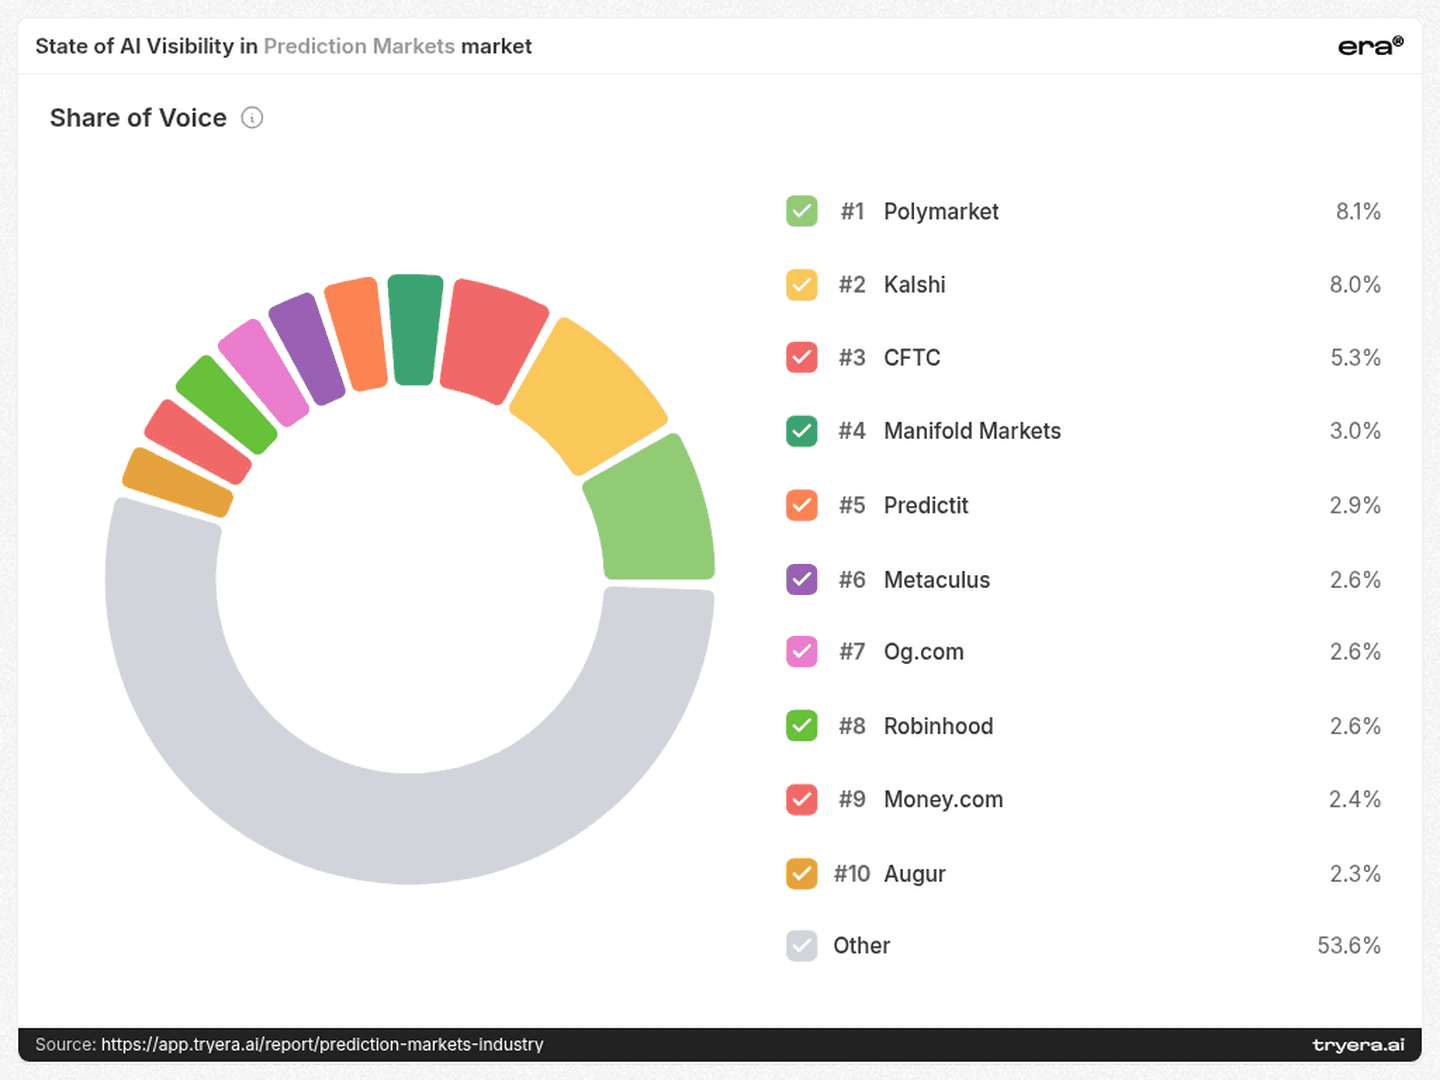
The answer market is larger than the platform roster
CFTC ranks third among named entities. Robinhood and Money.com also appear alongside operating prediction-market brands.
The page shows Polymarket at 8.1%, Kalshi at 8.0% and CFTC at 5.3%. Manifold Markets, PredictIt, Metaculus, OG.com, Robinhood, Money.com and Augur follow, while “Other” is displayed at 53.6%.
This is more than a long tail of small platforms. It is an entity-universe problem. A regulator, publisher and adjacent financial product can occupy the same answer space because the underlying prompts ask about legality, fees, risk, comparisons and access.
At 53.6%, “Other” is more than six times either leader. No named entity reaches double-digit Share of Voice, which makes the category look less like a winner-take-all platform market and more like a distributed answer ecosystem.
05 / Publisher power
The evidence market is led by sports publishers, not platform websites.
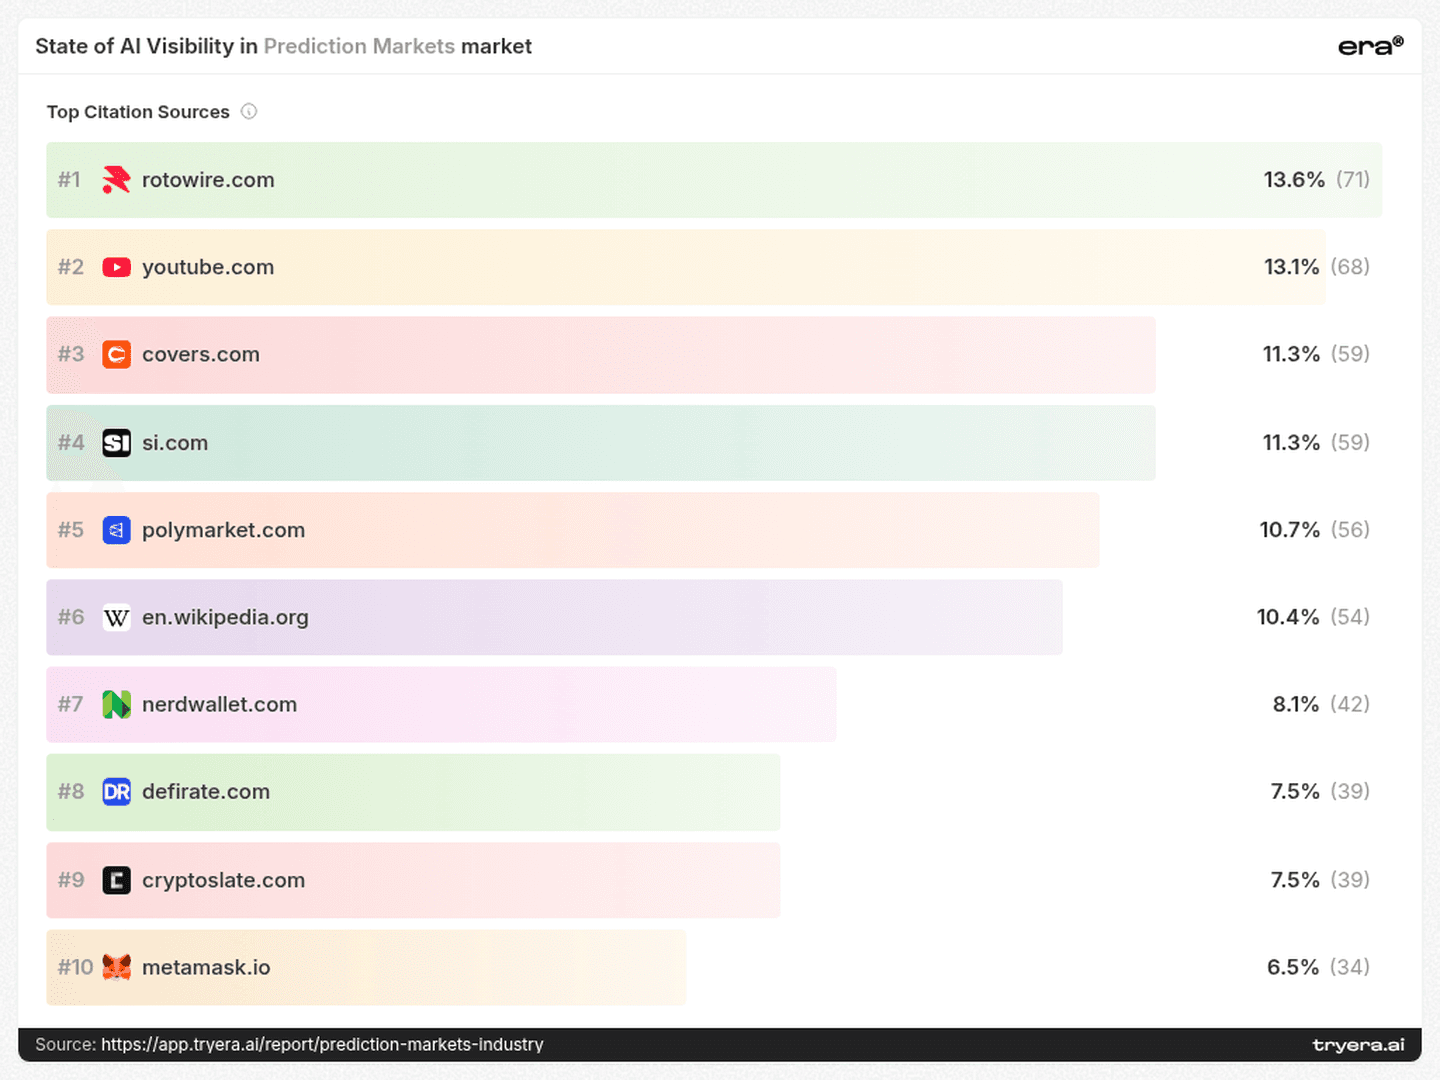
Polymarket is a leading brand and a source. Most competitors are only one of those.
The dominant evidence graph combines sports media, video, comparison sites, explainers and one platform-owned domain.
RotoWire has 71 displayed occurrences, followed by YouTube with 68, Covers and Sports Illustrated with 59 each, and Polymarket with 56. Wikipedia has 54, NerdWallet 42, DeFi Rate and CryptoSlate 39 each, and MetaMask 34.
Together, the ten leading domains account for 521 displayed citation occurrences. They form a mixed evidence system of sports media, video, explainers, crypto publishers and platform-owned content.
Polymarket’s fifth-place domain position gives it an additional route into answers: it can be the subject of a recommendation and part of the evidence used to construct one. For the rest of the market, the more important observation is external: the pages explaining the category are concentrated outside company control.
06 / URL leverage
Three URLs carry more evidence weight than most brands can manufacture.
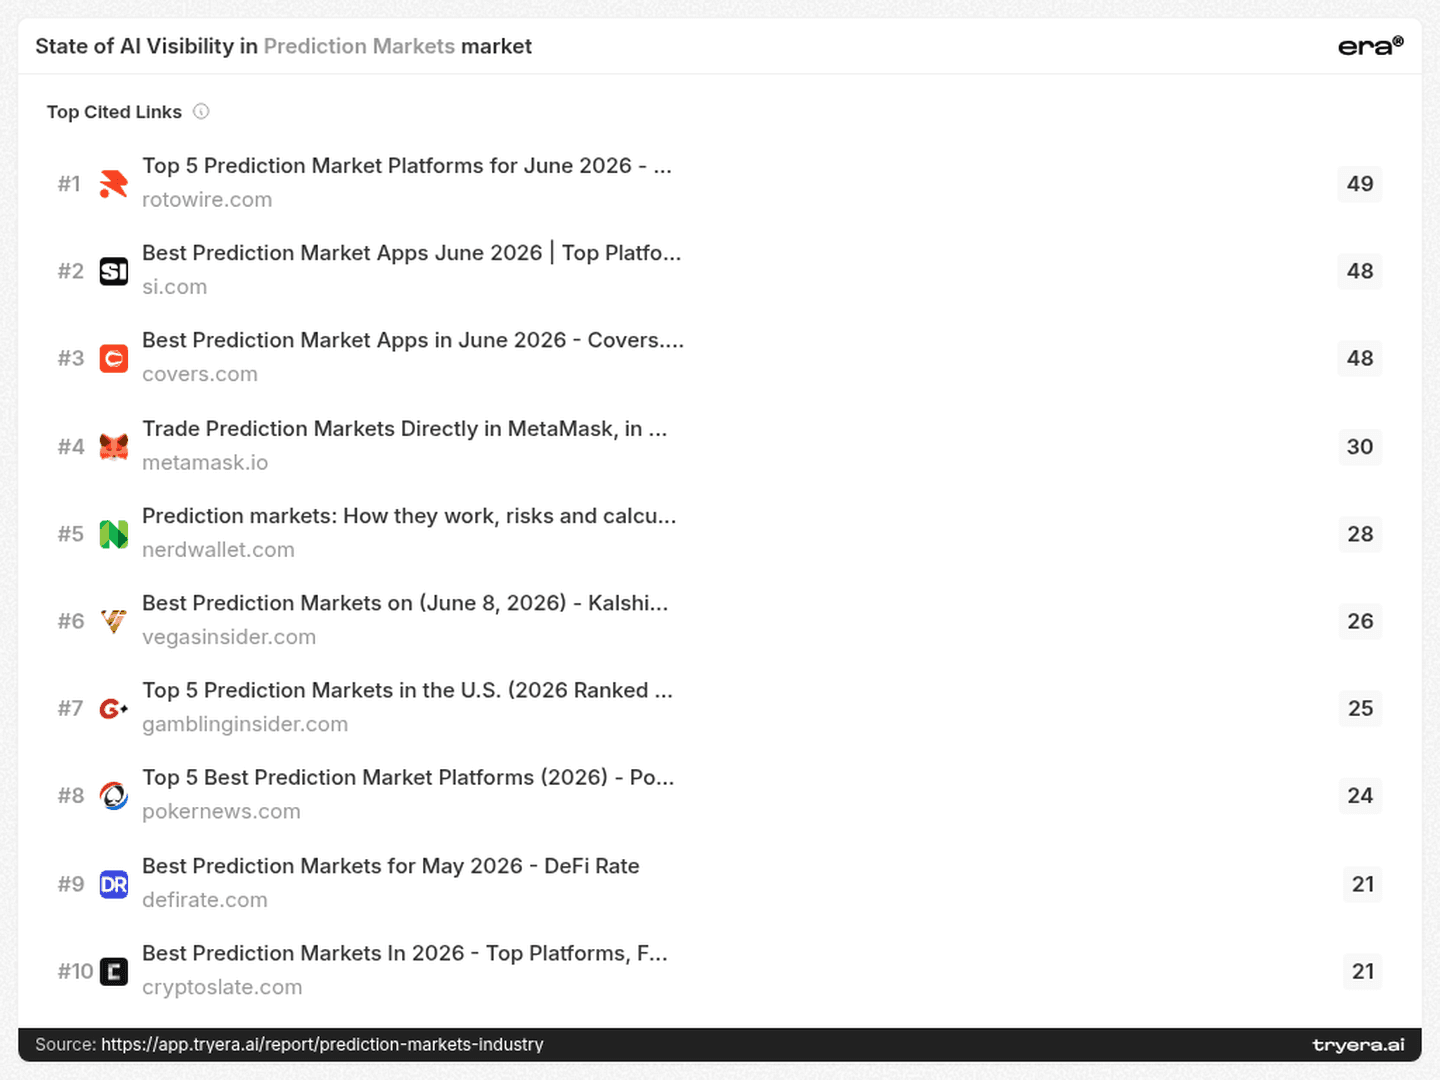
The high-leverage object is a canonical page, not a publisher relationship
The first three comparison pages total 145 displayed citation occurrences.
The RotoWire platform page leads with 49 occurrences. Sports Illustrated and Covers show 48 each. MetaMask’s prediction-markets page has 30 and NerdWallet’s explainer has 28. Across the ten rows, the displayed counts total 320.
Eight captured titles contain “Best” or “Top.” The two exceptions are a MetaMask access page and a NerdWallet explainer. In this measurement, comparison and education are not supporting formats; they are central retrieval surfaces.
These are the first pages a company should audit. Because they recur throughout the citation table, any stale fee, missing product, inconsistent name or unsupported legal claim deserves priority review.
07 / Borrowed proof
Even the two leaders borrow more than four-fifths of their displayed evidence.
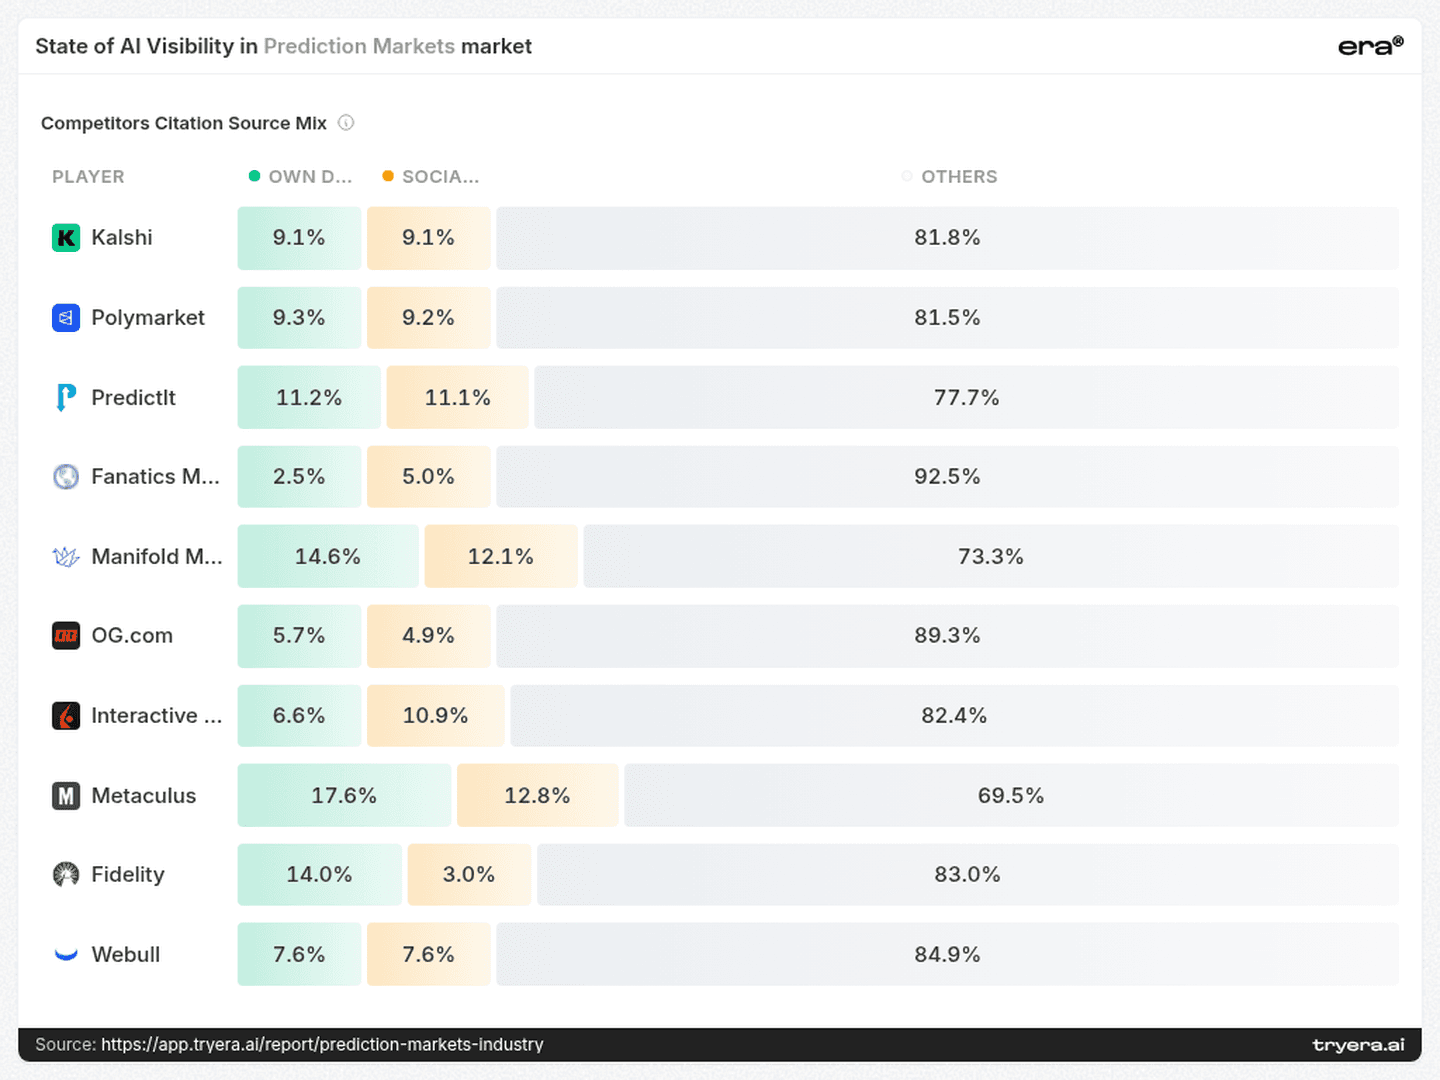
External dependence is the category norm, not a challenger weakness
No company in the visible table has an owned-plus-social majority.
“Others” accounts for 81.5% of Polymarket’s displayed mix and 81.8% of Kalshi’s. Across the table, it ranges from 69.5% for Metaculus to 92.5% for Fanatics Markets.
Even the category leaders rely on an evidence context built largely outside their own publishing channels. External validation is not a challenger tactic; it is the default architecture of the market.
A practical response is to keep three evidence layers consistent: owned facts, current announcements and independent comparison pages. Names, product claims and eligibility details should match across all three.
08 / Two bottlenecks
Being crawlable is infrastructure. Being selected is authority.
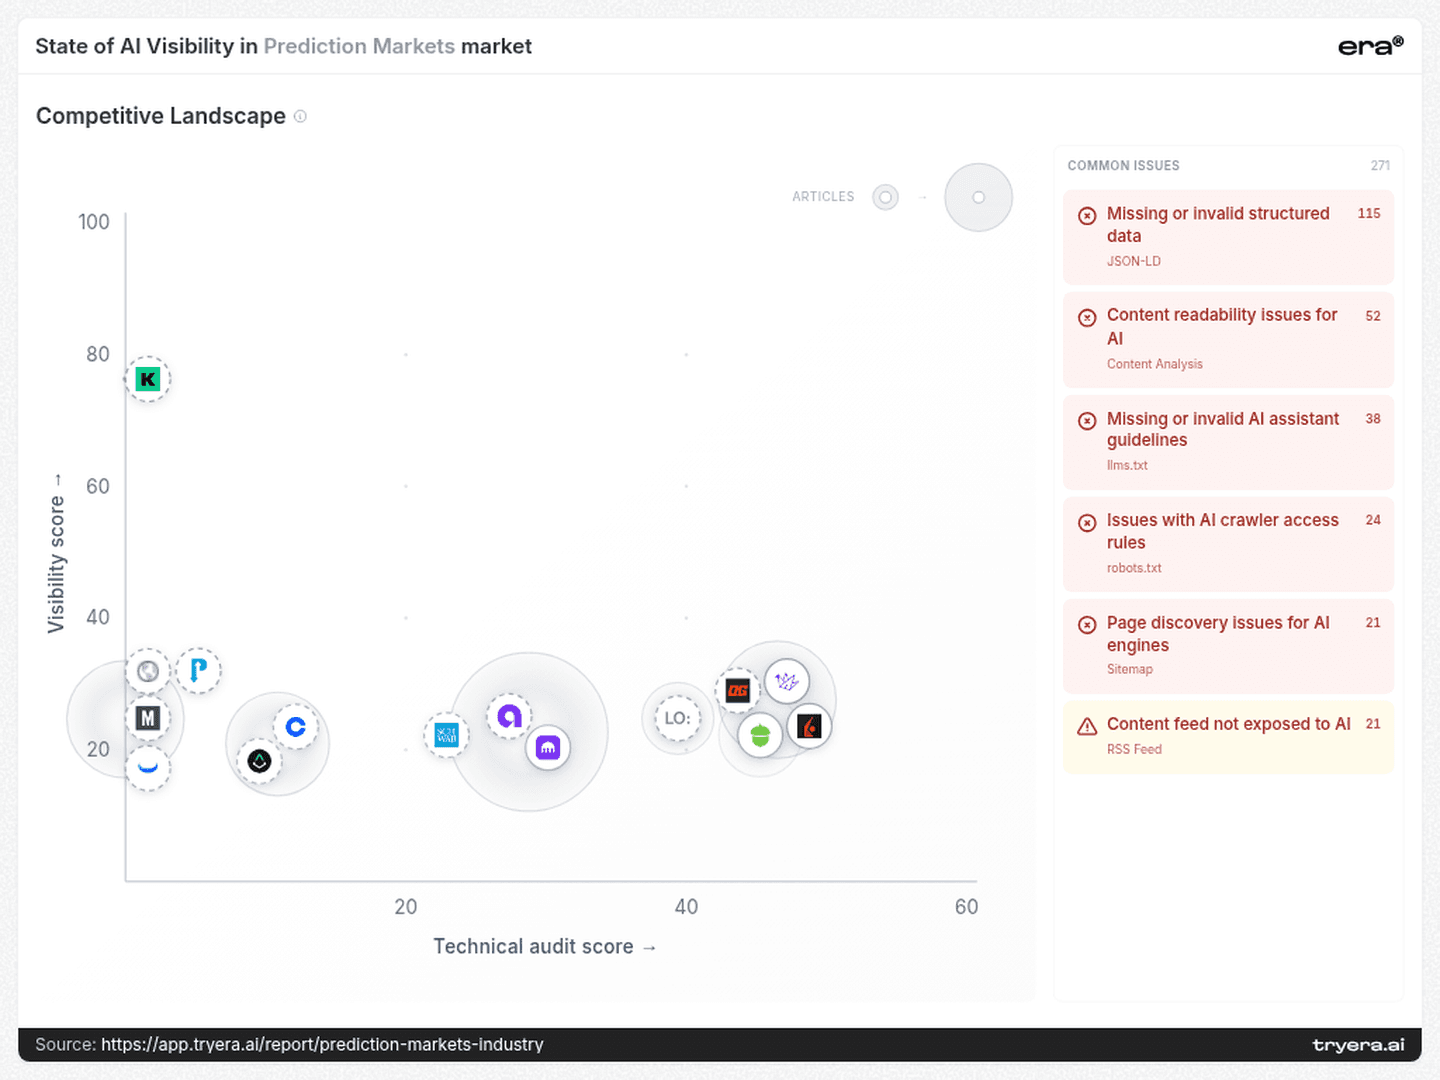
Technical readiness and answer authority are separate bottlenecks
The competitive landscape places audit performance and visibility on different axes—and teams need to manage both.
The page lists 115 missing or invalid structured-data issues, 52 readability issues, 38 AI-assistant-guideline issues, 24 crawler-rule issues, 21 page-discovery issues and 21 RSS-feed issues: 271 displayed occurrences in total.
Structured data is the largest issue category, but the landscape separates technical audit performance from visibility. Cleaner infrastructure and stronger answer presence are related operational goals, not the same score.
Technical readiness and answer authority should be managed as separate workstreams. The first covers crawler access, structure and readability; the second covers independent corroboration, entity consistency and presence on cited pages.
For challengers, the market is four retrieval systems and a handful of decisive URLs.
09 / 90-day plan
Build one evidence wedge, then expand it.
Days 1–30 · Establish the truth set
Create one canonical entity record: official name, domain, product names, aliases, and casing.
Re-test the six visible intent clusters across the four displayed providers with fixed wording.
Record Visibility, Share of Voice, Position, Citations, cited domains, and cited pages separately.
Audit JSON-LD, readability, llms.txt, robots.txt, sitemap, and RSS; do not assign the report-wide issue counts to a specific company.
Publish a source-of-truth page for fees, availability, market types, resolution, data access, and risk language.
Days 31–60 · Build proof and earn placement
Publish or refresh dated pages for platform comparison, fees, availability, political markets, crypto relevance, and API or export access.
Prepare a publisher fact sheet with primary-source URLs, definitions, limitations, and last-verified dates.
Audit RotoWire, SI, and Covers first; their three displayed pages total 145 occurrences.
Then address MetaMask and NerdWallet, which cover transaction and educational intent.
Request factual corrections or inclusion only where editorially relevant; do not send generic promotional copy.
Days 61–90 · Close provider gaps
Re-run the fixed query set and prioritize the worst provider cell, not the overall average.
Compare which sources each provider uses for the same query.
Correct entity ambiguity and unsupported category associations.
Re-crawl the technical audit after fixes.
Track movement in provider Visibility, Share of Voice, Position, Citations, and cited-page inclusion separately.
If your company is absent, start with the query, the provider and the cited page—not the leaderboard.
Want this scoreboard for your own brand? Run a free audit at tryera.ai/free-report — 30 minutes, your numbers, no deck required.
Full report with source data: Prediction Market Industry.



At first glance, this is a two-company market. Polymarket and Kalshi appear in roughly 86% of the monitored answers, while the next company on the podium is below 34%. That looks like a durable lead. The deeper pages complicate it. CFTC appears among the leading Share-of-Voice entities. Sports and betting publishers dominate the cited-source tables. Manifold Markets falls from 68% visibility on ChatGPT to 6% on Claude, while OG.com moves from 0% on ChatGPT to 52% on Claude. The category is stable only at the very top. That changes the strategic question. A prediction-market company is not competing for one universal ranking. It is competing to become the supported answer for a specific intent, inside a specific engine, using evidence that often lives on someone else’s URL.
The leaders are separated by decimals. The rest of the market is separated by systems.
Polymarket is shown at number one with 8.1% Share of Voice, 86.4% visibility, a reported rank of 1.9 and 573 citations. Kalshi follows with 8.0% Share of Voice, 86.9% visibility, rank 1.4 and 541 citations.
There is no single winner hiding inside those numbers. Polymarket has the larger displayed citation footprint and a fractional Share-of-Voice lead. Kalshi enters slightly more answers and is reported earlier when it appears. Leadership changes with the metric being optimized.
The important gap is not the half-point between the leaders. It is the stability gap between them and everyone else. The next question is therefore not “Who is number one?” It is “What makes the top two survive every retrieval environment while challengers disappear from some of them?”
01 / Stability premium
The real lead is not 86%. It is the absence of a weak engine.
The leaders have resilience; the challengers have peaks
A high average can be assembled from one strong engine and one near-disappearance. The top two do not pay that penalty.
Polymarket: 84%–90% across the four providers
Kalshi: 84%–89.8% across the four providers
Manifold Markets: 68% on ChatGPT → 6% on Claude
OG.com: 0% on ChatGPT → 52% on Claude
Fanatics Markets: 0% on ChatGPT → 44% on Claude
Polymarket ranges from 84% visibility on ChatGPT and Claude to 90% on Perplexity. Kalshi ranges from 84% on ChatGPT to 89.8% on Google AI. Their provider spread is six points or less.
The challenger profiles are different. Manifold Markets spans 68% on ChatGPT and 6% on Claude. OG.com spans 0% on ChatGPT and 52% on Claude. Fanatics Markets moves from 0% on ChatGPT to 44% on Claude. Metaculus reaches 46% on ChatGPT and only 2% on Google AI and Claude.
Provider stability is a competitive advantage in its own right. The leaders are not simply strong on average; they avoid the engine-specific collapse visible across the challenger set.
02 / Engine-native challengers
Below the top two, “more visible” and “better positioned” describe different companies.
There are two challenger problems, not one
Some brands appear in too few answers. Others appear more often but enter later.
Fidelity has 5.5% visibility and a reported rank of 1.5. LO:TECH has only 1.5% visibility and rank 1.3. Both are almost absent from the category, but strong when they are selected.
Metaculus has 18.6% visibility with rank 5.0. Augur has 16.1% visibility with rank 5.5. They reach more answers than Fidelity or LO:TECH, but enter much later.
That creates two distinct challenger profiles. Fidelity and LO:TECH have limited reach but strong reported positions when present; Metaculus and Augur reach more answers but appear substantially later.
03 / Category leakage
The prompt set turns brokers, regulators and data products into competitors.
The query decides who counts as a prediction-market competitor
Comparison, crypto, politics, fees, legal access and data export create different competitive sets.
“best prediction market platforms 2026”
“top prediction market platforms crypto”
“Polymarket political markets 2026”
“prediction markets best value after fees”
“US legal prediction markets competitive fees”
“PredictIt historical data API download subscription PredictIt data export”
Four players have “best prediction market platforms 2026” as their displayed top query. PredictIt peaks on “top prediction market platforms crypto.” Interactive Brokers peaks on “prediction markets best value after fees.” Webull peaks on “US legal prediction markets competitive fees.” Fidelity is tied to a PredictIt historical-data and export query.
Two community forecasting products—Manifold Markets and Metaculus—surface around “Polymarket political markets 2026.” Competitor-branded intent is therefore an entry surface: a company can enter the answer by helping the model resolve a question centered on a rival.
This is why a generic “prediction market platform” page is strategically incomplete. The answer set reorganizes around the buyer’s task, and that task can pull in a broker, a forecasting community, a data workflow or a regulatory entity.
04 / Unpriced field
Eight percent can lead when the category boundary keeps moving.
The answer market is larger than the platform roster
CFTC ranks third among named entities. Robinhood and Money.com also appear alongside operating prediction-market brands.
The page shows Polymarket at 8.1%, Kalshi at 8.0% and CFTC at 5.3%. Manifold Markets, PredictIt, Metaculus, OG.com, Robinhood, Money.com and Augur follow, while “Other” is displayed at 53.6%.
This is more than a long tail of small platforms. It is an entity-universe problem. A regulator, publisher and adjacent financial product can occupy the same answer space because the underlying prompts ask about legality, fees, risk, comparisons and access.
At 53.6%, “Other” is more than six times either leader. No named entity reaches double-digit Share of Voice, which makes the category look less like a winner-take-all platform market and more like a distributed answer ecosystem.
05 / Publisher power
The evidence market is led by sports publishers, not platform websites.
Polymarket is a leading brand and a source. Most competitors are only one of those.
The dominant evidence graph combines sports media, video, comparison sites, explainers and one platform-owned domain.
RotoWire has 71 displayed occurrences, followed by YouTube with 68, Covers and Sports Illustrated with 59 each, and Polymarket with 56. Wikipedia has 54, NerdWallet 42, DeFi Rate and CryptoSlate 39 each, and MetaMask 34.
Together, the ten leading domains account for 521 displayed citation occurrences. They form a mixed evidence system of sports media, video, explainers, crypto publishers and platform-owned content.
Polymarket’s fifth-place domain position gives it an additional route into answers: it can be the subject of a recommendation and part of the evidence used to construct one. For the rest of the market, the more important observation is external: the pages explaining the category are concentrated outside company control.
06 / URL leverage
Three URLs carry more evidence weight than most brands can manufacture.
The high-leverage object is a canonical page, not a publisher relationship
The first three comparison pages total 145 displayed citation occurrences.
The RotoWire platform page leads with 49 occurrences. Sports Illustrated and Covers show 48 each. MetaMask’s prediction-markets page has 30 and NerdWallet’s explainer has 28. Across the ten rows, the displayed counts total 320.
Eight captured titles contain “Best” or “Top.” The two exceptions are a MetaMask access page and a NerdWallet explainer. In this measurement, comparison and education are not supporting formats; they are central retrieval surfaces.
These are the first pages a company should audit. Because they recur throughout the citation table, any stale fee, missing product, inconsistent name or unsupported legal claim deserves priority review.
07 / Borrowed proof
Even the two leaders borrow more than four-fifths of their displayed evidence.
External dependence is the category norm, not a challenger weakness
No company in the visible table has an owned-plus-social majority.
“Others” accounts for 81.5% of Polymarket’s displayed mix and 81.8% of Kalshi’s. Across the table, it ranges from 69.5% for Metaculus to 92.5% for Fanatics Markets.
Even the category leaders rely on an evidence context built largely outside their own publishing channels. External validation is not a challenger tactic; it is the default architecture of the market.
A practical response is to keep three evidence layers consistent: owned facts, current announcements and independent comparison pages. Names, product claims and eligibility details should match across all three.
08 / Two bottlenecks
Being crawlable is infrastructure. Being selected is authority.
Technical readiness and answer authority are separate bottlenecks
The competitive landscape places audit performance and visibility on different axes—and teams need to manage both.
The page lists 115 missing or invalid structured-data issues, 52 readability issues, 38 AI-assistant-guideline issues, 24 crawler-rule issues, 21 page-discovery issues and 21 RSS-feed issues: 271 displayed occurrences in total.
Structured data is the largest issue category, but the landscape separates technical audit performance from visibility. Cleaner infrastructure and stronger answer presence are related operational goals, not the same score.
Technical readiness and answer authority should be managed as separate workstreams. The first covers crawler access, structure and readability; the second covers independent corroboration, entity consistency and presence on cited pages.
For challengers, the market is four retrieval systems and a handful of decisive URLs.
09 / 90-day plan
Build one evidence wedge, then expand it.
Days 1–30 · Establish the truth set
Create one canonical entity record: official name, domain, product names, aliases, and casing.
Re-test the six visible intent clusters across the four displayed providers with fixed wording.
Record Visibility, Share of Voice, Position, Citations, cited domains, and cited pages separately.
Audit JSON-LD, readability, llms.txt, robots.txt, sitemap, and RSS; do not assign the report-wide issue counts to a specific company.
Publish a source-of-truth page for fees, availability, market types, resolution, data access, and risk language.
Days 31–60 · Build proof and earn placement
Publish or refresh dated pages for platform comparison, fees, availability, political markets, crypto relevance, and API or export access.
Prepare a publisher fact sheet with primary-source URLs, definitions, limitations, and last-verified dates.
Audit RotoWire, SI, and Covers first; their three displayed pages total 145 occurrences.
Then address MetaMask and NerdWallet, which cover transaction and educational intent.
Request factual corrections or inclusion only where editorially relevant; do not send generic promotional copy.
Days 61–90 · Close provider gaps
Re-run the fixed query set and prioritize the worst provider cell, not the overall average.
Compare which sources each provider uses for the same query.
Correct entity ambiguity and unsupported category associations.
Re-crawl the technical audit after fixes.
Track movement in provider Visibility, Share of Voice, Position, Citations, and cited-page inclusion separately.
If your company is absent, start with the query, the provider and the cited page—not the leaderboard.
Want this scoreboard for your own brand? Run a free audit at tryera.ai/free-report — 30 minutes, your numbers, no deck required.
Full report with source data: Prediction Market Industry.