
September 1, 2026
September 1, 2026
Which Mailbox Providers for Cold Outreach Get Recommended by AI? We Analyzed the Market to Find What Works
Outreach leads AI Visibility for cold-outreach mailbox queries, Instantly leads Share of Voice, and the most-cited pages split between official sender rules and independent provider shortlists.
Outreach leads AI Visibility for cold-outreach mailbox queries, Instantly leads Share of Voice, and the most-cited pages split between official sender rules and independent provider shortlists.
Outreach leads Era’s cold-outreach mailbox podium with 88.0% Visibility. Instantly leads the separate Share of Voice table at 13.8%. The most-cited individual page is neither company’s website: it is a third-party mailbox-provider shortlist. Era tested 50 prompts across 200 answers from ChatGPT, Perplexity, Google AI and Claude, identifying 35 players and 386 sources. The result matters to any provider selling inboxes, domains, warmup or sending infrastructure because the AI shortlist is being assembled from a much wider market. Visibility, Share of Voice, position and citations cannot be collapsed into one ranking. Each metric exposes a different part of the buying decision — reach, attention, placement and the evidence used to justify the answer.
A mailbox query begins with an inbox. The answer rarely stays there.
Era’s report produces a category collision: a sales-execution platform leads the podium; productivity suites occupy second and third; CRM and revenue platforms complete the top five; specialist mailbox brands dominate a different metric. AI is not reproducing a vendor category. It is assembling the people, infrastructure, rules and software needed to make outbound email work.
01 / Category boundary
The podium is an outbound stack
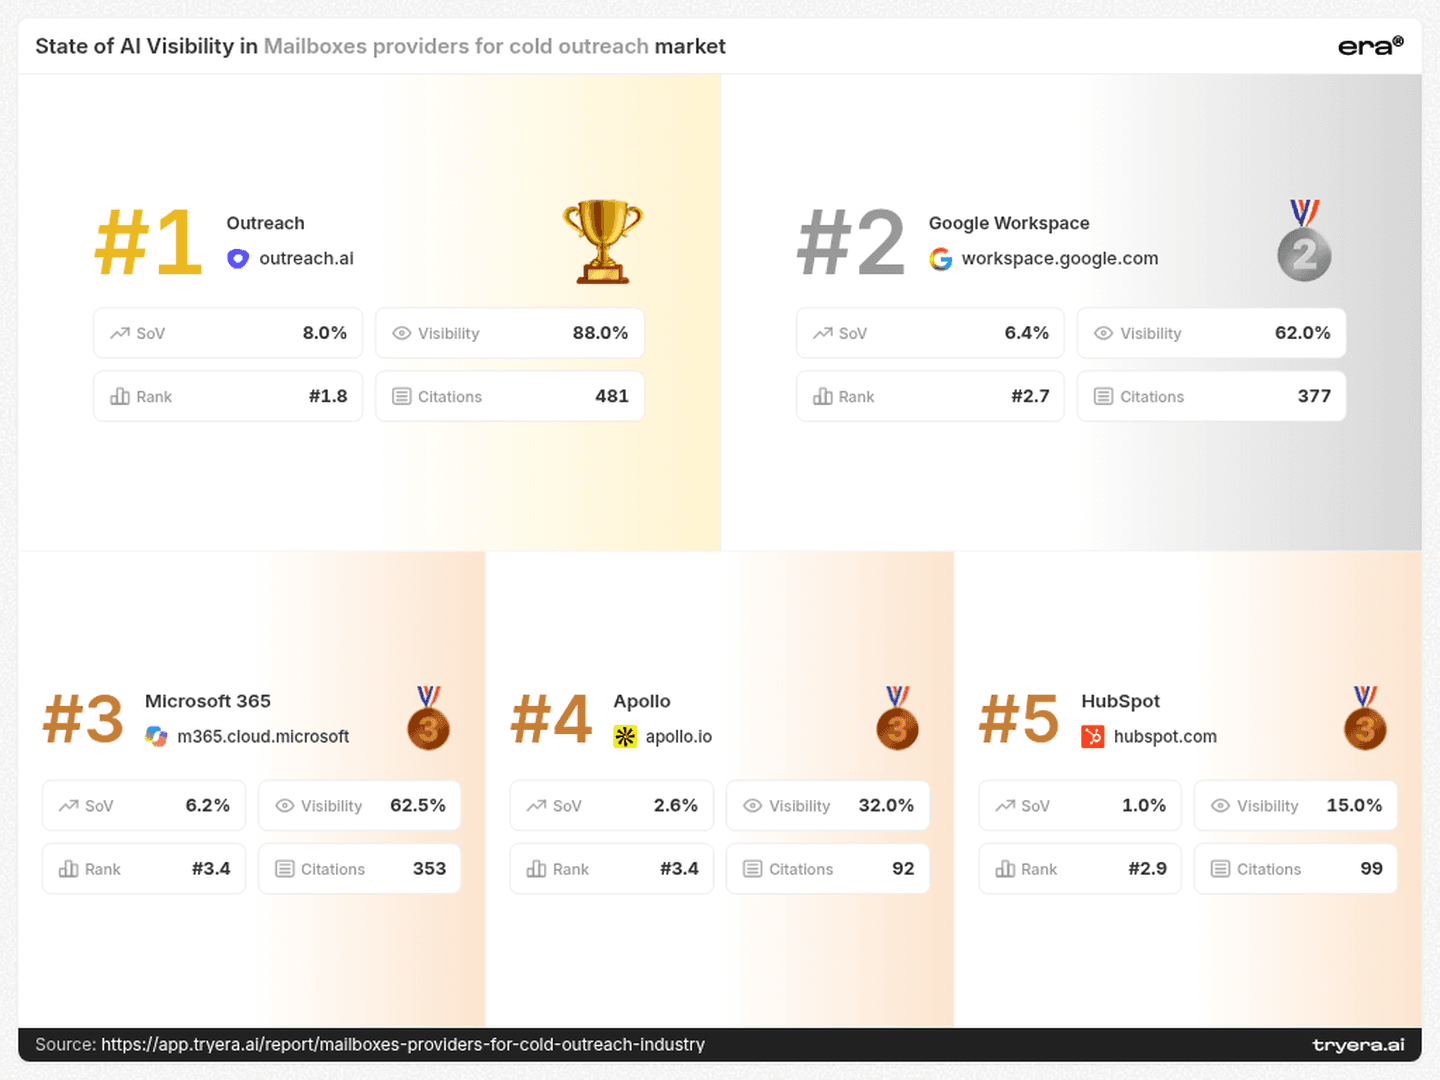
Outreach leads with 88.0% Visibility, an average #1.8 Rank and 481 citations. Google Workspace and Microsoft 365 follow at 62.0% and 62.5% Visibility. Apollo and HubSpot complete the podium.
Those five companies occupy at least three product layers: sales execution, core email infrastructure and revenue workflow. The wider table stretches the boundary further. Primeforge, Maildoso and Mailforge sit beside Salesforce, Zoho Mail, ActiveCampaign, Pipedrive, Mailchimp and other tools that do not sell the same product in the same way.
The common denominator is not the inbox. It is the buyer’s need to send at scale, protect deliverability, coordinate outreach and move a reply into a commercial workflow.
The competitive set expands whenever the buyer’s job expands beyond provisioning the mailbox.
A specialist provider is therefore not competing only with another specialist. On a limits question it competes with Google or Microsoft documentation; on a workflow question it competes with Apollo or HubSpot; on a “best provider” question it competes with whichever vendors an independent comparison page chooses to include.
02 / Four scoreboards
Change the metric and the winner changes
Outreach’s podium line combines 88.0% Visibility, 8.0% Share of Voice, a #1.8 average Rank and 481 citations. But the adjacent tables immediately rearrange the market.
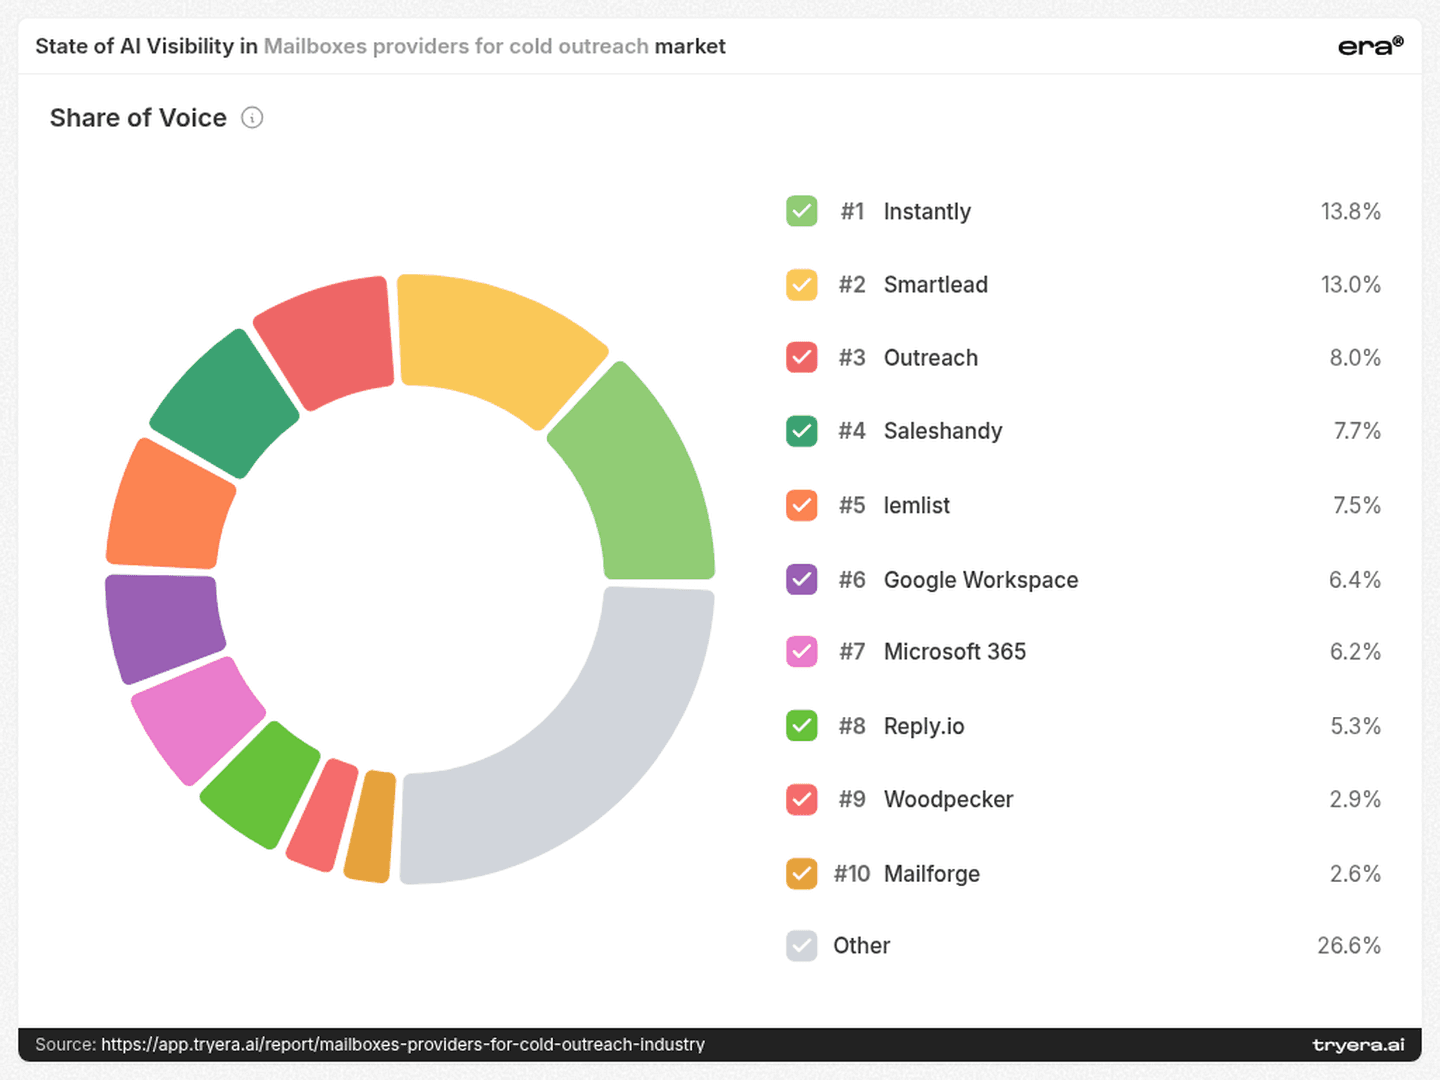
Instantly owns the largest share of tracked player mentions at 13.8%, followed by Smartlead at 13.0%. Saleshandy reaches 7.7% and lemlist 7.5%. All four sit ahead of Google Workspace and Microsoft 365 on Share of Voice, although neither Instantly nor Smartlead appears in the podium five.
Even near-identical reach can hide a different quality of presence. Microsoft 365 records 62.5% Visibility versus Google Workspace at 62.0%, but Google Workspace holds the stronger average position — #2.7 versus #3.4 — and more citations, 377 versus 353. Apollo reaches 32.0% Visibility with 92 citations; HubSpot reaches only 15.0% but still collects 99 citations and a better #2.9 average Rank.
AI leadership here is plural: Visibility rewards breadth, Share of Voice rewards conversational share, Rank rewards placement when present, and citations show the amount of referenced evidence attached to that presence.
For a mailbox provider, the diagnosis must be metric-specific. Low Visibility means too many answers omit the brand. Weak Share of Voice means the brand may appear without owning much of the comparison. A good Rank with limited Visibility means the company can place well when retrieved while still missing most opportunities.
03 / Provider markets
The average hides where a brand actually exists
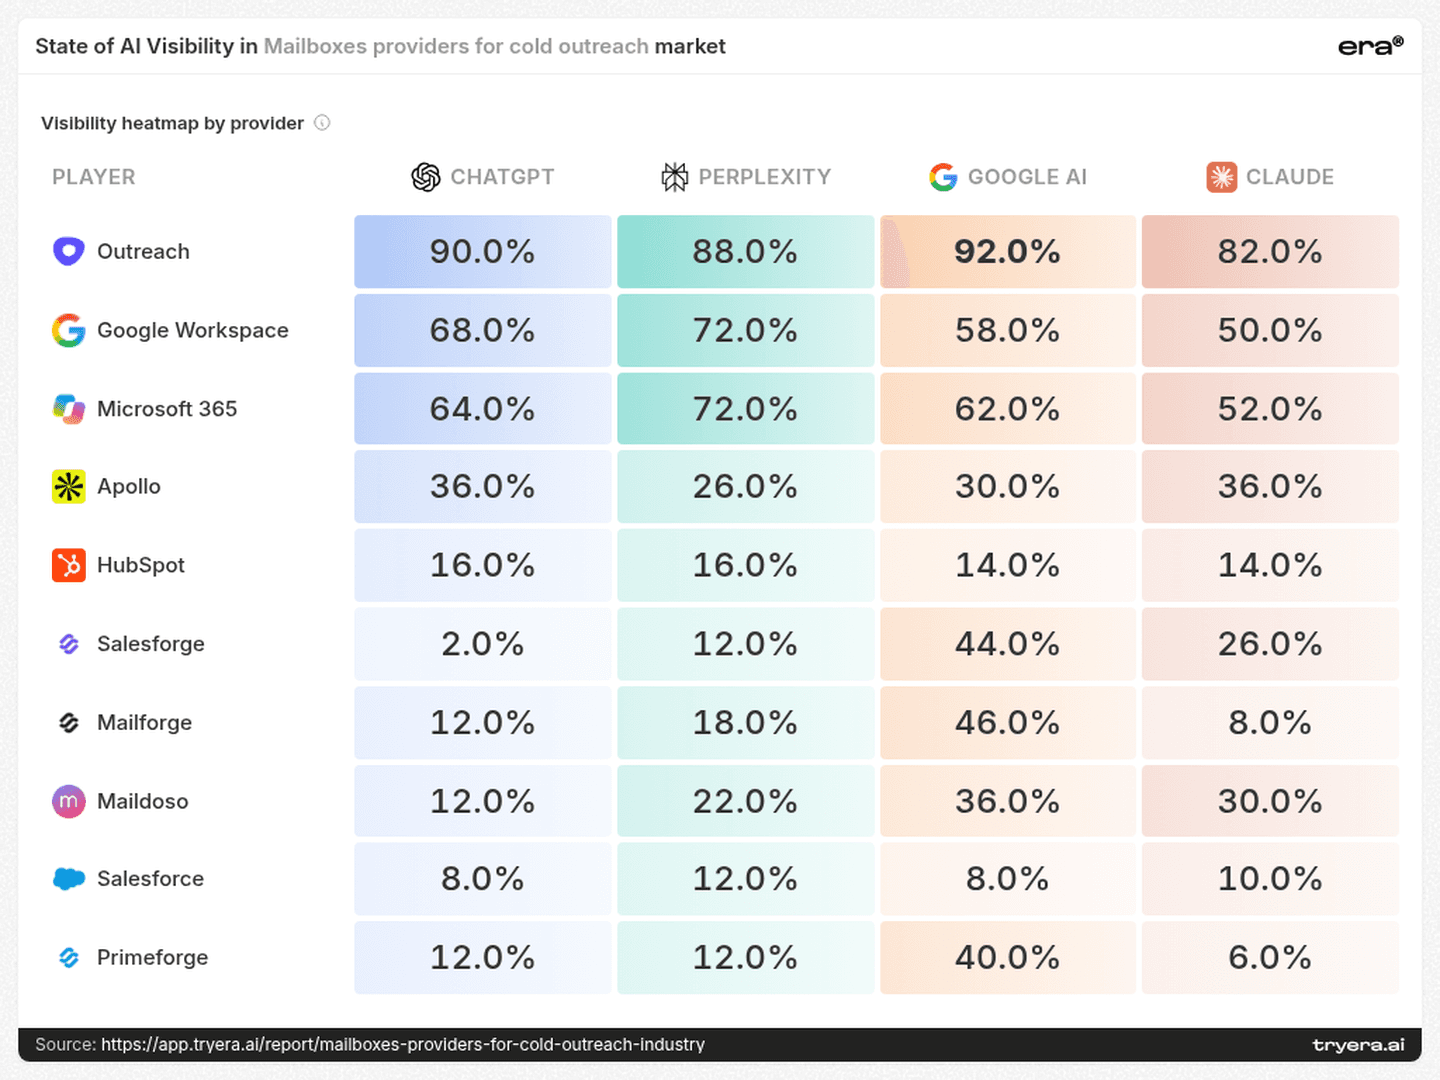
Outreach is the only high-visibility constant across all four providers: 90% in ChatGPT, 88% in Perplexity, 92% in Google AI and 82% in Claude. Google Workspace ranges from 50% to 72%; Microsoft 365 from 52% to 72%. Their blended averages describe broad presence rather than one engine carrying the result.
The specialists occupy different provider markets. Salesforge moves from 2% in ChatGPT to 44% in Google AI. Mailforge moves from 8% in Claude to 46% in Google AI. Primeforge moves from 6% in Claude to 40% in Google AI. Maildoso is more balanced, yet still ranges from 12% to 36%.
Salesforge’s average compresses a 42-point gap into one number.
That gap changes the operating question. A challenger concentrated in Google AI does not have a general awareness problem; it has a distribution problem across answer engines. The next audit should match the same intent on all four providers, then trace which entities and source pages appear where the brand disappears.
04 / Buyer intent
Every query redraws the category
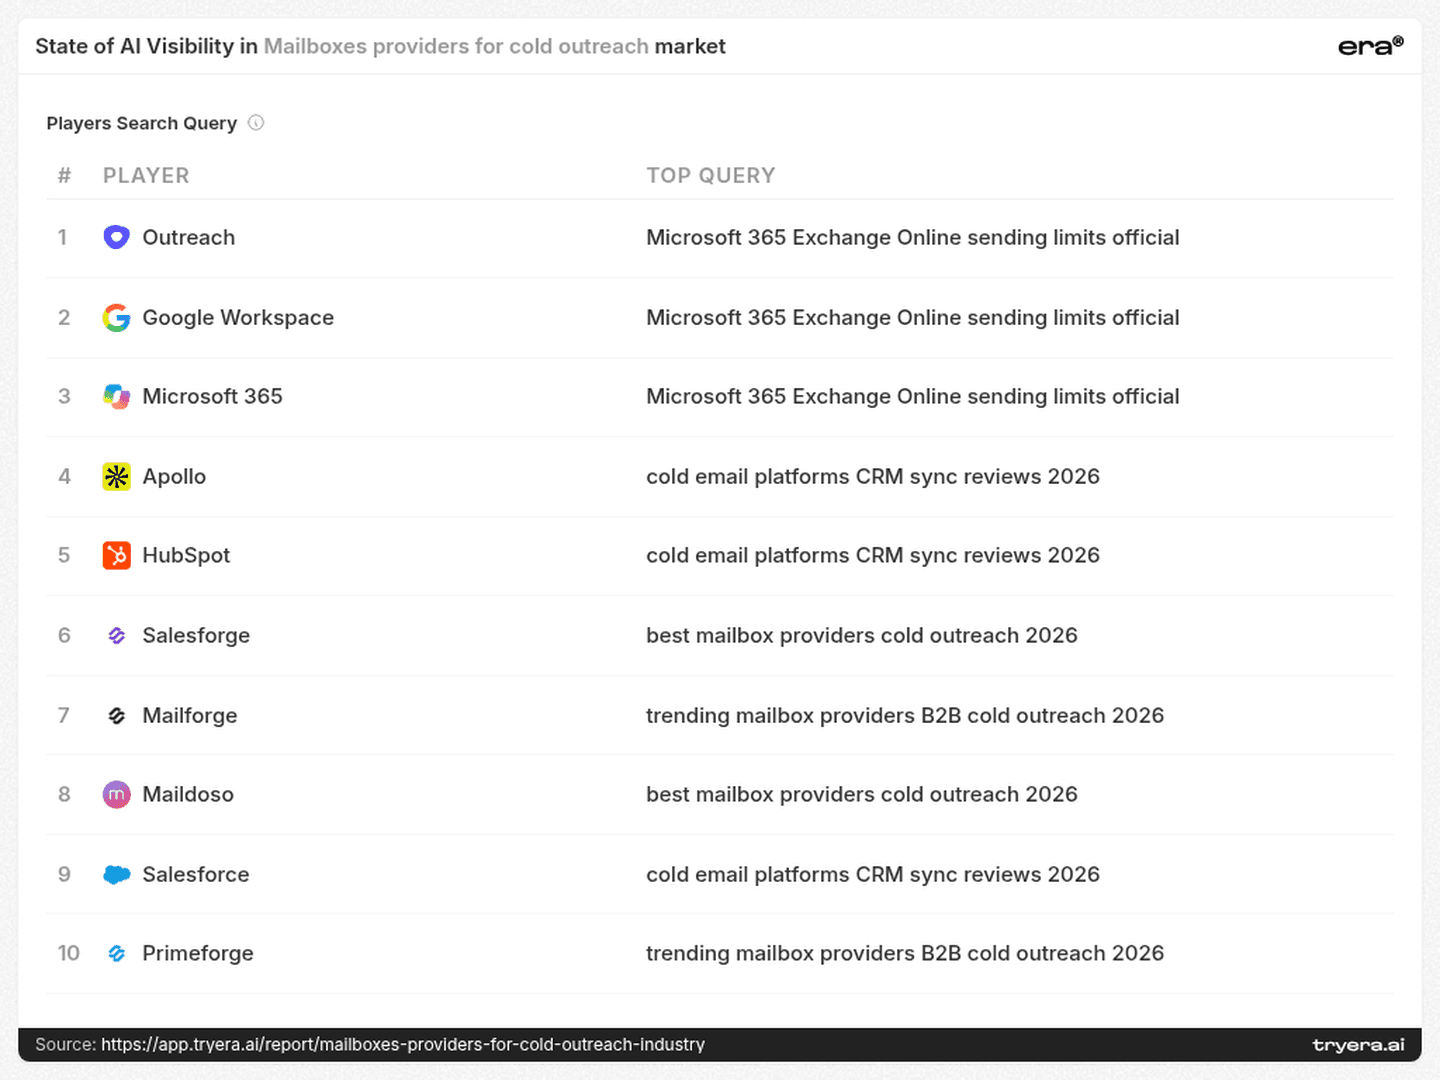
The player-query page explains why dissimilar companies share one report. Outreach, Google Workspace and Microsoft 365 all perform most strongly on “Microsoft 365 Exchange Online sending limits official.” Apollo and HubSpot peak on “cold email platforms CRM sync reviews 2026.” Salesforge and Maildoso peak on “best mailbox providers cold outreach 2026,” while Mailforge and Primeforge peak on a trend-led provider query.
The buyer is moving through four different decisions:
Infrastructure rules: official limits, authentication, deliverability and sender safety.
Market selection: best providers, comparisons, ratings and reviews.
Workflow fit: CRM sync, automation and automatic deal updates.
Commercial fit: price, inbox volume, team size, support and compliance.
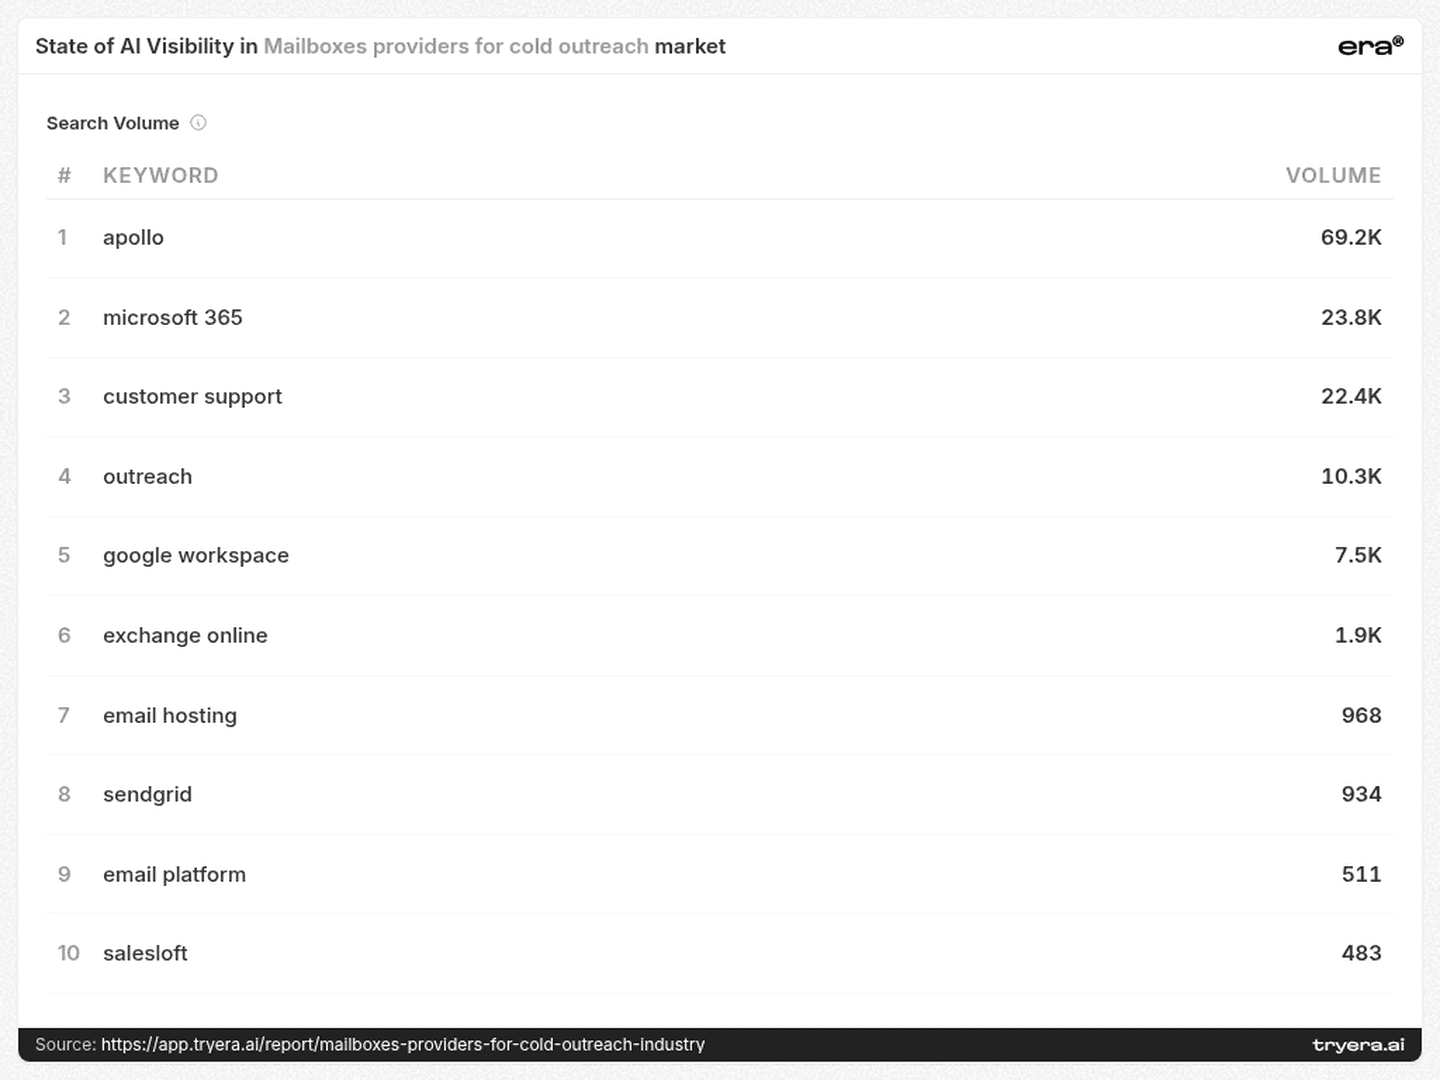
The search-volume page reinforces the category split. Its largest displayed terms are branded or adjacent: “Apollo” at 69.2K, “Microsoft 365” at 23.8K, “customer support” at 22.4K, “Outreach” at 10.3K and “Google Workspace” at 7.5K. The generic phrase “email hosting” appears at 968.
This is not a clean estimate of mailbox demand. It is evidence that discovery language crosses brand, infrastructure and operational problems. A specialist does not need one generic “best mailbox” page; it needs a portfolio of proof tied to the buyer jobs it can credibly own.
05 / Evidence layer
Most of the proof sits outside the vendor’s site
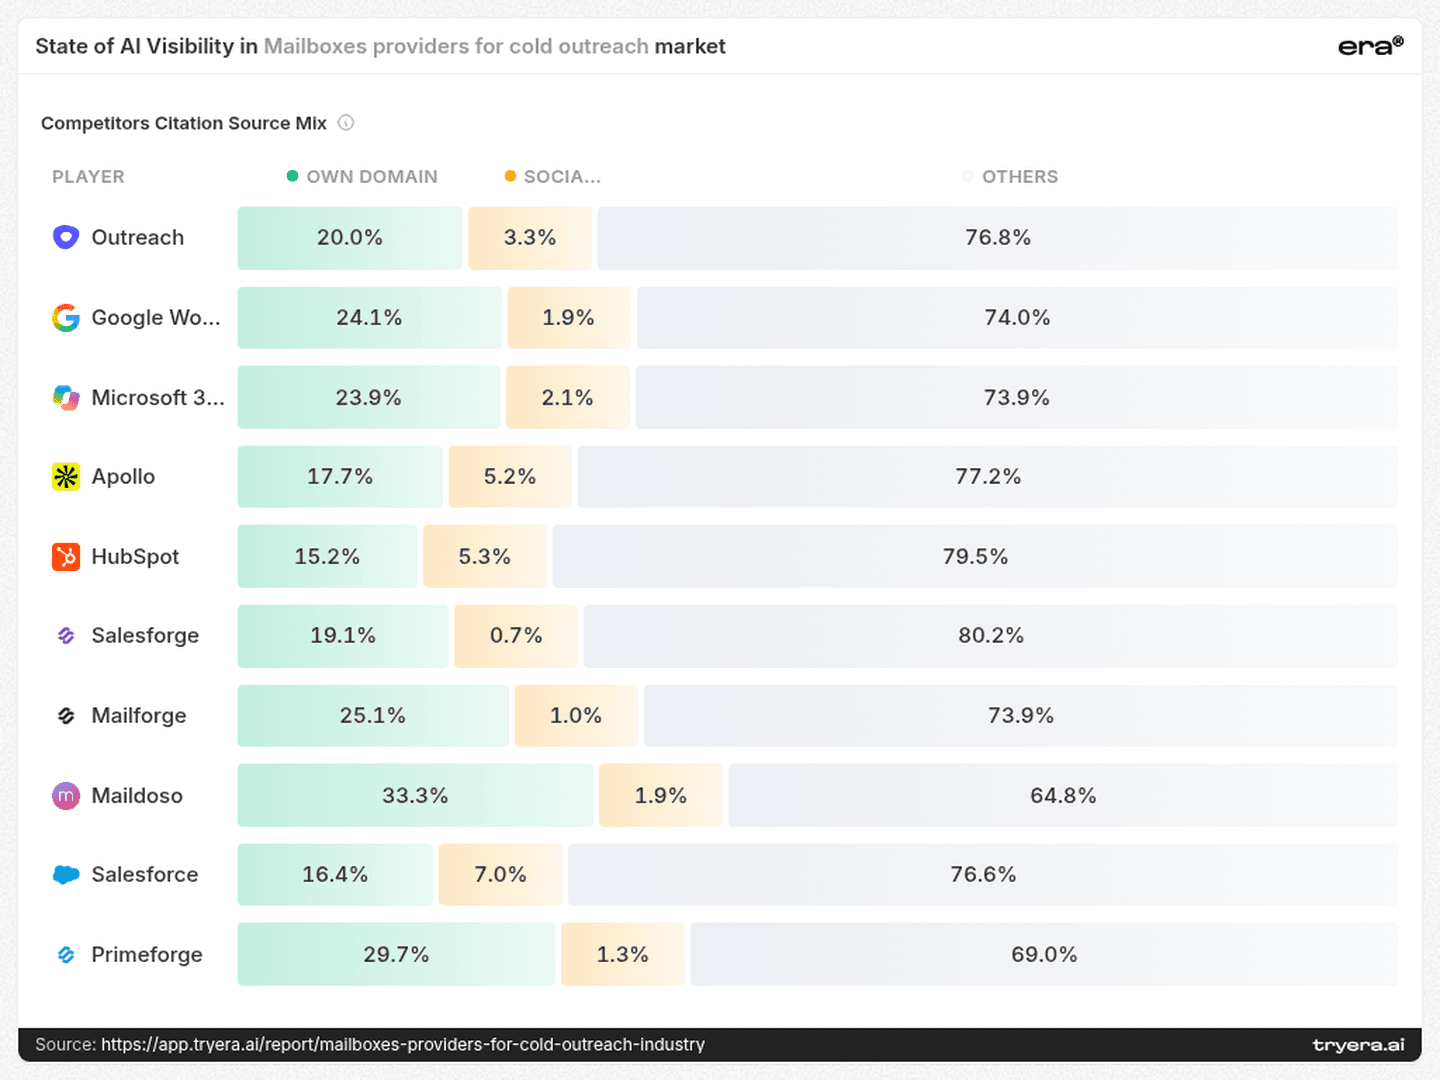
Across every player in the citation-mix table, “Other” sources provide the majority of cited evidence: 64.8% to 80.2%. Owned domains range from 15.2% for HubSpot to 33.3% for Maildoso. Social sources contribute only 0.7% to 7.0%.
The domain chart adds an important nuance. Specialist-owned sites can still become meaningful sources: mailforge.ai records 73 citations and salesforge.ai 71. Yet even for the players displayed in the mix, owned sources never become the majority. The answer is assembled from a network, not from a homepage.
A mailbox brand’s AI presence is evidenced largely by pages it does not control.
That changes the content strategy. Owned pages must make limits, pricing, integrations, warmup methodology and compliance claims easy to retrieve. But the brand also needs accurate representation in the comparison pages and official resources that AI already uses to verify the market.
06 / Source system
Rules pages grant permission; shortlists grant inclusion
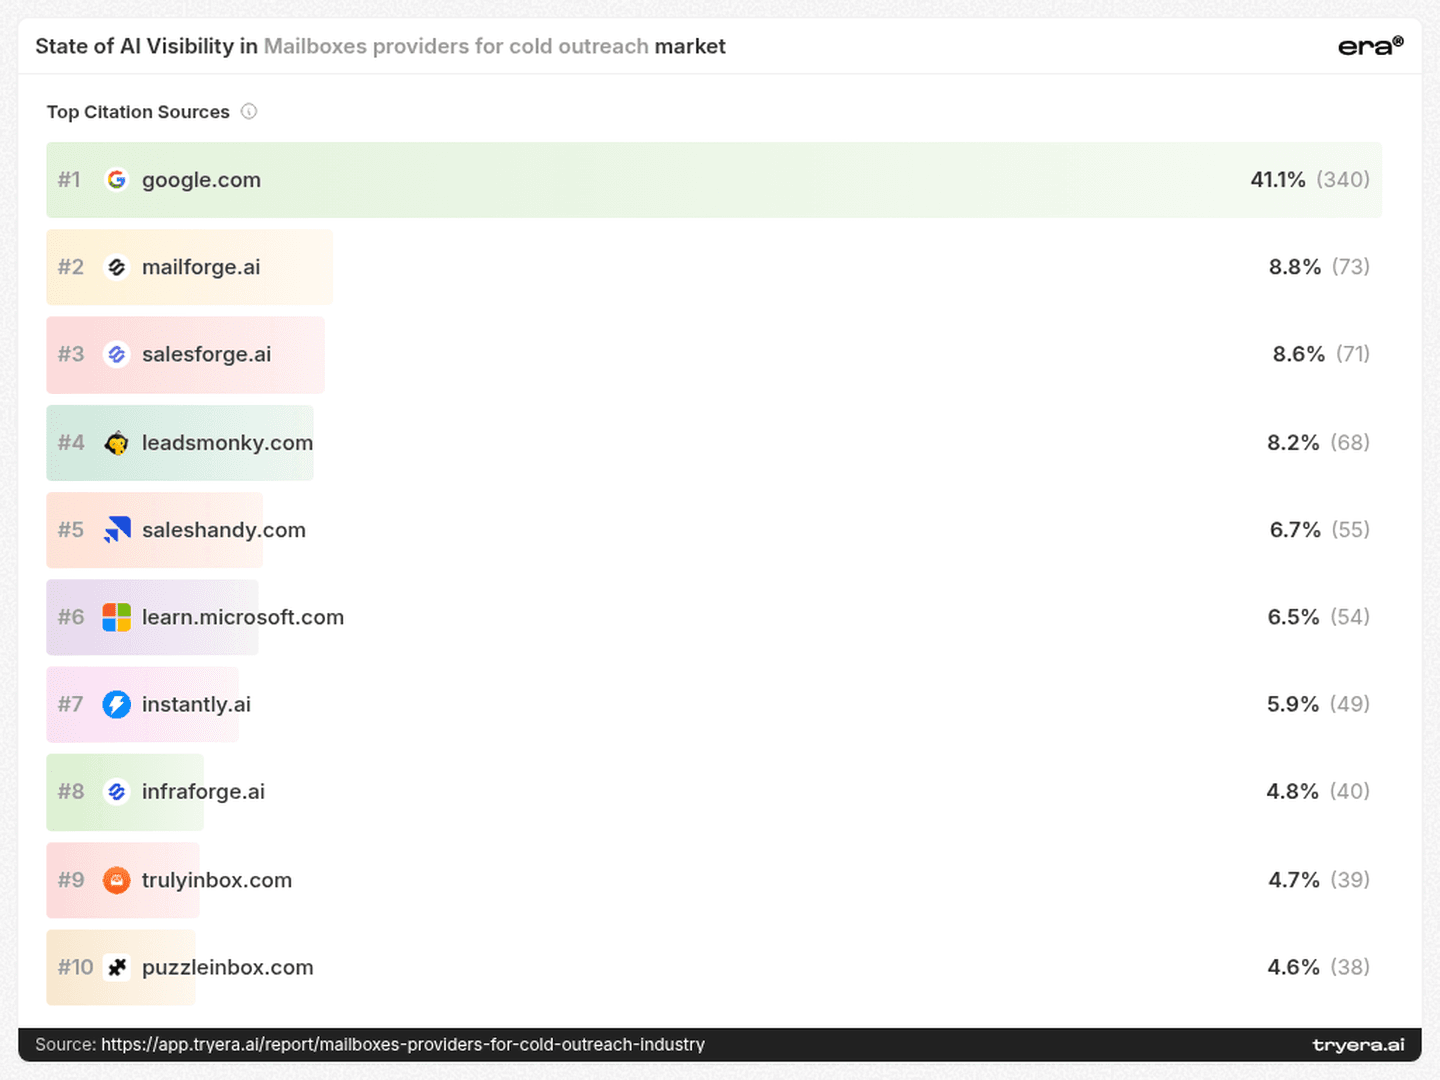
Google.com leads the displayed citation-source set with 340 occurrences, or 41.1%. Learn.microsoft.com contributes another 54. This concentration matches the query map: official Microsoft sending limits are the strongest displayed query for Outreach, Google Workspace and Microsoft 365.
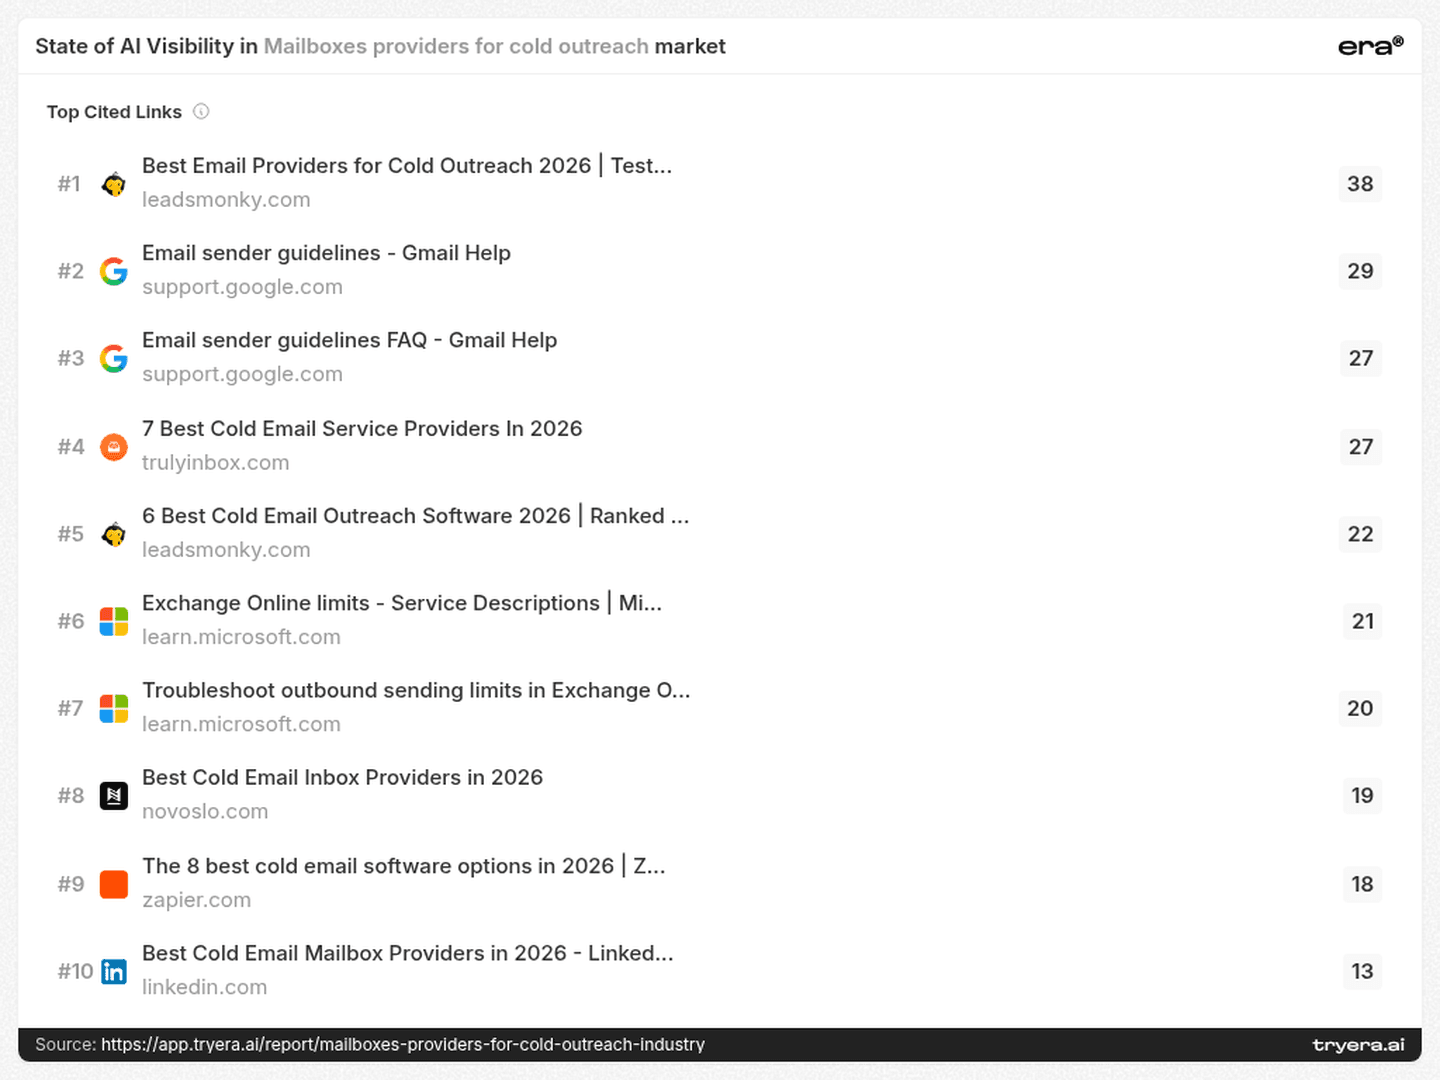
At URL level, however, the most-cited page is a market comparison. LeadsMonky’s Best Email Providers for Cold Outreach 2026 appears 38 times. Google’s Email sender guidelines appears 29 times and its sender-guidelines FAQ 27 times. TrulyInbox’s cold email service provider comparison also appears 27 times.
These pages perform different jobs. Official documentation defines what is allowed, how limits work and what must be fixed. Independent shortlists decide which providers enter consideration, which use cases they represent and which alternatives sit beside them.
A provider can publish excellent documentation and still be absent from the shortlist layer. It can also win list inclusion while lacking the primary evidence needed for a limits or compliance question. Durable visibility requires both: first-party proof that can be checked and third-party pages willing to classify the company correctly.
07 / Authority mismatch
Domain scale does not reproduce the AI leaderboard
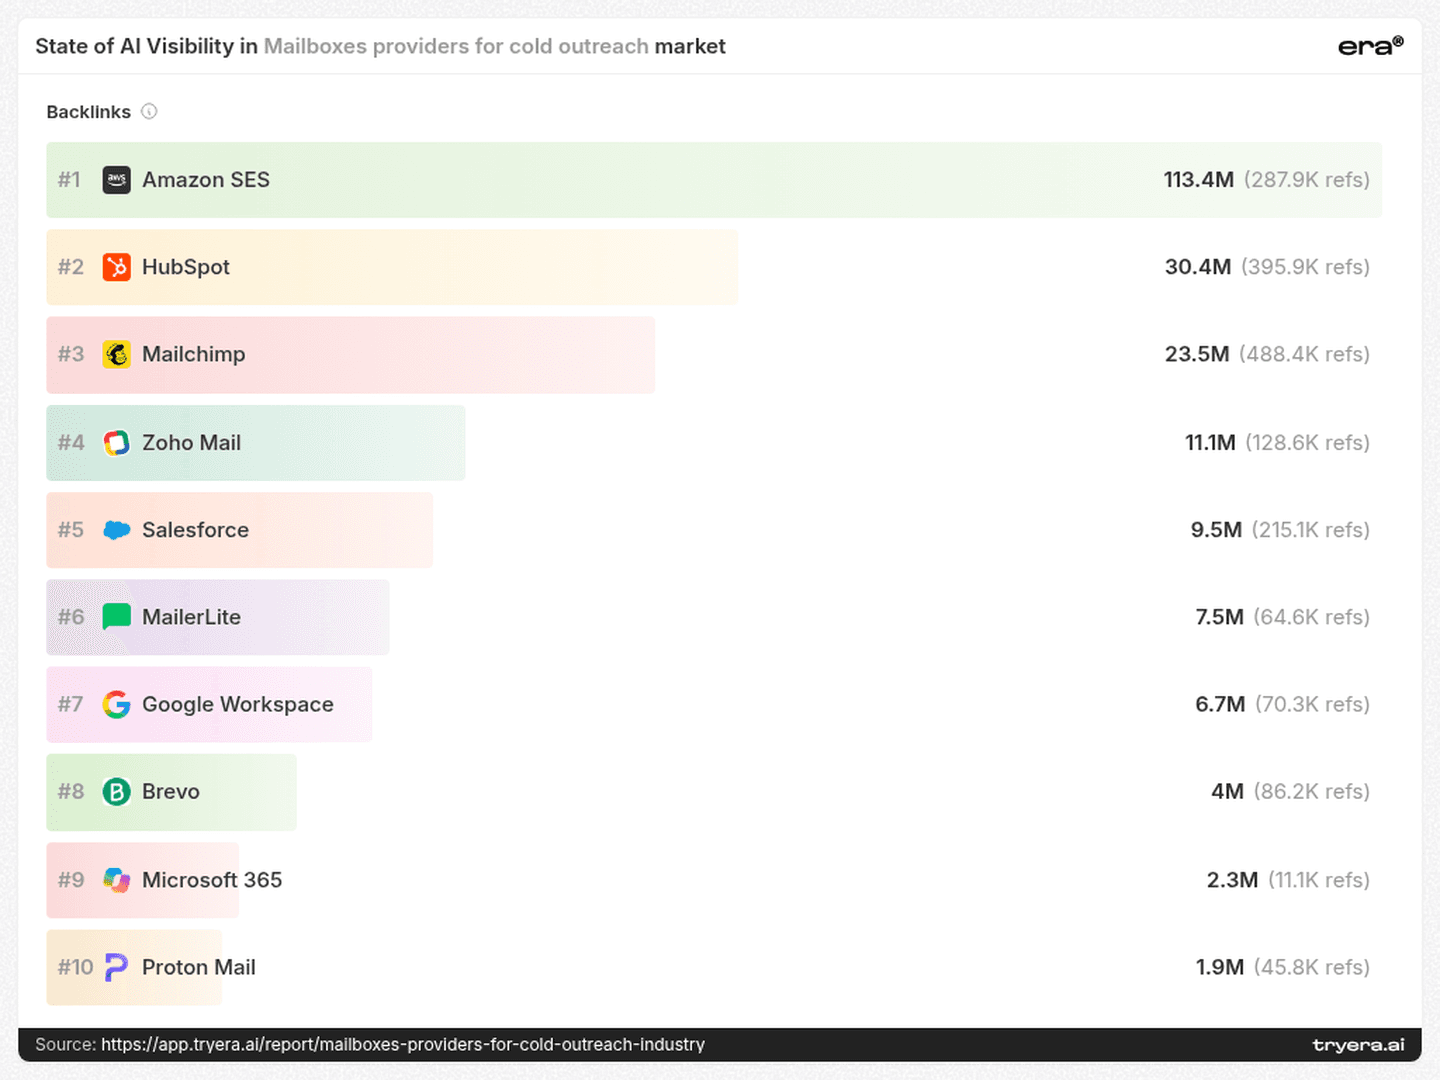
Amazon SES leads the backlink chart with 113.4 million backlinks but does not appear in the podium five. HubSpot is second at 30.4 million, yet records 15.0% Visibility, 1.0% Share of Voice and 99 citations.
Outreach moves in the opposite direction: it does not appear in the backlink top ten, but leads the podium at 88.0% Visibility and 481 citations. Google Workspace has 6.7 million backlinks and 62.0% Visibility; Microsoft 365 has 2.3 million and 62.5% Visibility.
The rankings do not form a one-variable ladder from domain authority to AI presence. Backlinks may support authority, but the report shows that scale alone does not determine whether the right entity and evidence are retrieved for a mailbox question.
A useful audit therefore separates domain-wide authority from intent-specific proof. The relevant question is not only how many sites link to the domain, but whether authoritative pages support the exact claim the buyer is asking an AI system to resolve.
08 / Technical readiness
Technical fixes remove friction; they do not manufacture proof

The competitive landscape places technical audit score and Visibility on different axes. Outreach occupies the strongest combined position in the displayed field. Microsoft 365 retains substantial Visibility despite sitting much farther left on technical readiness. The specialist cluster is technically tighter but less visible.
The report records 356 common issues: 142 missing or invalid JSON-LD items, 84 content-readability issues, 58 llms.txt issues, 32 robots.txt issues, 26 missing content feeds and 14 sitemap issues.
Those problems can block discovery, interpretation and reliable entity resolution. They still cannot substitute for an official limits page, a verifiable integration claim or accurate inclusion in an external comparison.
For this market, technical work and evidence work must run together: make product boundaries and claims machine-readable, remove crawler and discovery blockers, then ensure the same facts are independently confirmable in the sources already shaping the answer.
09 / 90-Day plan
Turn the report into an operating system
Days 1–30 — Find the exact market you are losing
Separate Visibility, Share of Voice and Position across four query groups: infrastructure rules, provider shortlists, workflow fit and commercial fit.
Build a ChatGPT × Perplexity × Google AI × Claude matrix for the exact prompts that matter; start with the largest provider-specific gap rather than the blended average.
Audit the cited pages already shaping those queries, including the LeadsMonky and TrulyInbox comparisons plus Google and Microsoft sender documentation.
Resolve product naming and category boundaries across the website, review sites and comparison pages so the same entity is not described as an inbox, warmup tool, email platform and outreach suite without a clear relationship.
Days 31–60 — Build proof for one buyer job
Publish an explicit reference for the chosen intent: a sending-limits matrix, deliverability methodology, inbox-and-domain pricing architecture, compliance checklist or documented CRM workflow.
Make every commercial claim testable: define what is included, what changes the price, which limits apply and which evidence supports deliverability or automation claims.
Fix the 142 JSON-LD issues first, then readability, robots.txt, sitemap and feed discovery problems that prevent those proof assets from travelling cleanly.
Give comparison publishers current facts, precise product boundaries and primary supporting URLs instead of generic positioning copy.
Days 61–90 — Test whether the evidence travels
Re-run the same prompts on all four providers and record whether gains come from broader presence, a stronger average position or a larger share of the answer.
For brands concentrated in Google AI, test whether ChatGPT and Claude can retrieve equivalent first-party and independent evidence.
Update the external pages that already receive citations before pitching dozens of unrelated new lists.
Keep the measurement unit fixed: intent × provider × evidence source. Treat the overall average as the summary, never the diagnosis.
Want this scoreboard for your own brand?
Run a free audit at tryera.ai/free-report — 30 minutes, your numbers, no deck required.
Full report with source data: Mailboxes providers for cold outreach.



Outreach leads Era’s cold-outreach mailbox podium with 88.0% Visibility. Instantly leads the separate Share of Voice table at 13.8%. The most-cited individual page is neither company’s website: it is a third-party mailbox-provider shortlist. Era tested 50 prompts across 200 answers from ChatGPT, Perplexity, Google AI and Claude, identifying 35 players and 386 sources. The result matters to any provider selling inboxes, domains, warmup or sending infrastructure because the AI shortlist is being assembled from a much wider market. Visibility, Share of Voice, position and citations cannot be collapsed into one ranking. Each metric exposes a different part of the buying decision — reach, attention, placement and the evidence used to justify the answer.
A mailbox query begins with an inbox. The answer rarely stays there.
Era’s report produces a category collision: a sales-execution platform leads the podium; productivity suites occupy second and third; CRM and revenue platforms complete the top five; specialist mailbox brands dominate a different metric. AI is not reproducing a vendor category. It is assembling the people, infrastructure, rules and software needed to make outbound email work.
01 / Category boundary
The podium is an outbound stack
Outreach leads with 88.0% Visibility, an average #1.8 Rank and 481 citations. Google Workspace and Microsoft 365 follow at 62.0% and 62.5% Visibility. Apollo and HubSpot complete the podium.
Those five companies occupy at least three product layers: sales execution, core email infrastructure and revenue workflow. The wider table stretches the boundary further. Primeforge, Maildoso and Mailforge sit beside Salesforce, Zoho Mail, ActiveCampaign, Pipedrive, Mailchimp and other tools that do not sell the same product in the same way.
The common denominator is not the inbox. It is the buyer’s need to send at scale, protect deliverability, coordinate outreach and move a reply into a commercial workflow.
The competitive set expands whenever the buyer’s job expands beyond provisioning the mailbox.
A specialist provider is therefore not competing only with another specialist. On a limits question it competes with Google or Microsoft documentation; on a workflow question it competes with Apollo or HubSpot; on a “best provider” question it competes with whichever vendors an independent comparison page chooses to include.
02 / Four scoreboards
Change the metric and the winner changes
Outreach’s podium line combines 88.0% Visibility, 8.0% Share of Voice, a #1.8 average Rank and 481 citations. But the adjacent tables immediately rearrange the market.
Instantly owns the largest share of tracked player mentions at 13.8%, followed by Smartlead at 13.0%. Saleshandy reaches 7.7% and lemlist 7.5%. All four sit ahead of Google Workspace and Microsoft 365 on Share of Voice, although neither Instantly nor Smartlead appears in the podium five.
Even near-identical reach can hide a different quality of presence. Microsoft 365 records 62.5% Visibility versus Google Workspace at 62.0%, but Google Workspace holds the stronger average position — #2.7 versus #3.4 — and more citations, 377 versus 353. Apollo reaches 32.0% Visibility with 92 citations; HubSpot reaches only 15.0% but still collects 99 citations and a better #2.9 average Rank.
AI leadership here is plural: Visibility rewards breadth, Share of Voice rewards conversational share, Rank rewards placement when present, and citations show the amount of referenced evidence attached to that presence.
For a mailbox provider, the diagnosis must be metric-specific. Low Visibility means too many answers omit the brand. Weak Share of Voice means the brand may appear without owning much of the comparison. A good Rank with limited Visibility means the company can place well when retrieved while still missing most opportunities.
03 / Provider markets
The average hides where a brand actually exists
Outreach is the only high-visibility constant across all four providers: 90% in ChatGPT, 88% in Perplexity, 92% in Google AI and 82% in Claude. Google Workspace ranges from 50% to 72%; Microsoft 365 from 52% to 72%. Their blended averages describe broad presence rather than one engine carrying the result.
The specialists occupy different provider markets. Salesforge moves from 2% in ChatGPT to 44% in Google AI. Mailforge moves from 8% in Claude to 46% in Google AI. Primeforge moves from 6% in Claude to 40% in Google AI. Maildoso is more balanced, yet still ranges from 12% to 36%.
Salesforge’s average compresses a 42-point gap into one number.
That gap changes the operating question. A challenger concentrated in Google AI does not have a general awareness problem; it has a distribution problem across answer engines. The next audit should match the same intent on all four providers, then trace which entities and source pages appear where the brand disappears.
04 / Buyer intent
Every query redraws the category
The player-query page explains why dissimilar companies share one report. Outreach, Google Workspace and Microsoft 365 all perform most strongly on “Microsoft 365 Exchange Online sending limits official.” Apollo and HubSpot peak on “cold email platforms CRM sync reviews 2026.” Salesforge and Maildoso peak on “best mailbox providers cold outreach 2026,” while Mailforge and Primeforge peak on a trend-led provider query.
The buyer is moving through four different decisions:
Infrastructure rules: official limits, authentication, deliverability and sender safety.
Market selection: best providers, comparisons, ratings and reviews.
Workflow fit: CRM sync, automation and automatic deal updates.
Commercial fit: price, inbox volume, team size, support and compliance.
The search-volume page reinforces the category split. Its largest displayed terms are branded or adjacent: “Apollo” at 69.2K, “Microsoft 365” at 23.8K, “customer support” at 22.4K, “Outreach” at 10.3K and “Google Workspace” at 7.5K. The generic phrase “email hosting” appears at 968.
This is not a clean estimate of mailbox demand. It is evidence that discovery language crosses brand, infrastructure and operational problems. A specialist does not need one generic “best mailbox” page; it needs a portfolio of proof tied to the buyer jobs it can credibly own.
05 / Evidence layer
Most of the proof sits outside the vendor’s site
Across every player in the citation-mix table, “Other” sources provide the majority of cited evidence: 64.8% to 80.2%. Owned domains range from 15.2% for HubSpot to 33.3% for Maildoso. Social sources contribute only 0.7% to 7.0%.
The domain chart adds an important nuance. Specialist-owned sites can still become meaningful sources: mailforge.ai records 73 citations and salesforge.ai 71. Yet even for the players displayed in the mix, owned sources never become the majority. The answer is assembled from a network, not from a homepage.
A mailbox brand’s AI presence is evidenced largely by pages it does not control.
That changes the content strategy. Owned pages must make limits, pricing, integrations, warmup methodology and compliance claims easy to retrieve. But the brand also needs accurate representation in the comparison pages and official resources that AI already uses to verify the market.
06 / Source system
Rules pages grant permission; shortlists grant inclusion
Google.com leads the displayed citation-source set with 340 occurrences, or 41.1%. Learn.microsoft.com contributes another 54. This concentration matches the query map: official Microsoft sending limits are the strongest displayed query for Outreach, Google Workspace and Microsoft 365.
At URL level, however, the most-cited page is a market comparison. LeadsMonky’s Best Email Providers for Cold Outreach 2026 appears 38 times. Google’s Email sender guidelines appears 29 times and its sender-guidelines FAQ 27 times. TrulyInbox’s cold email service provider comparison also appears 27 times.
These pages perform different jobs. Official documentation defines what is allowed, how limits work and what must be fixed. Independent shortlists decide which providers enter consideration, which use cases they represent and which alternatives sit beside them.
A provider can publish excellent documentation and still be absent from the shortlist layer. It can also win list inclusion while lacking the primary evidence needed for a limits or compliance question. Durable visibility requires both: first-party proof that can be checked and third-party pages willing to classify the company correctly.
07 / Authority mismatch
Domain scale does not reproduce the AI leaderboard
Amazon SES leads the backlink chart with 113.4 million backlinks but does not appear in the podium five. HubSpot is second at 30.4 million, yet records 15.0% Visibility, 1.0% Share of Voice and 99 citations.
Outreach moves in the opposite direction: it does not appear in the backlink top ten, but leads the podium at 88.0% Visibility and 481 citations. Google Workspace has 6.7 million backlinks and 62.0% Visibility; Microsoft 365 has 2.3 million and 62.5% Visibility.
The rankings do not form a one-variable ladder from domain authority to AI presence. Backlinks may support authority, but the report shows that scale alone does not determine whether the right entity and evidence are retrieved for a mailbox question.
A useful audit therefore separates domain-wide authority from intent-specific proof. The relevant question is not only how many sites link to the domain, but whether authoritative pages support the exact claim the buyer is asking an AI system to resolve.
08 / Technical readiness
Technical fixes remove friction; they do not manufacture proof
The competitive landscape places technical audit score and Visibility on different axes. Outreach occupies the strongest combined position in the displayed field. Microsoft 365 retains substantial Visibility despite sitting much farther left on technical readiness. The specialist cluster is technically tighter but less visible.
The report records 356 common issues: 142 missing or invalid JSON-LD items, 84 content-readability issues, 58 llms.txt issues, 32 robots.txt issues, 26 missing content feeds and 14 sitemap issues.
Those problems can block discovery, interpretation and reliable entity resolution. They still cannot substitute for an official limits page, a verifiable integration claim or accurate inclusion in an external comparison.
For this market, technical work and evidence work must run together: make product boundaries and claims machine-readable, remove crawler and discovery blockers, then ensure the same facts are independently confirmable in the sources already shaping the answer.
09 / 90-Day plan
Turn the report into an operating system
Days 1–30 — Find the exact market you are losing
Separate Visibility, Share of Voice and Position across four query groups: infrastructure rules, provider shortlists, workflow fit and commercial fit.
Build a ChatGPT × Perplexity × Google AI × Claude matrix for the exact prompts that matter; start with the largest provider-specific gap rather than the blended average.
Audit the cited pages already shaping those queries, including the LeadsMonky and TrulyInbox comparisons plus Google and Microsoft sender documentation.
Resolve product naming and category boundaries across the website, review sites and comparison pages so the same entity is not described as an inbox, warmup tool, email platform and outreach suite without a clear relationship.
Days 31–60 — Build proof for one buyer job
Publish an explicit reference for the chosen intent: a sending-limits matrix, deliverability methodology, inbox-and-domain pricing architecture, compliance checklist or documented CRM workflow.
Make every commercial claim testable: define what is included, what changes the price, which limits apply and which evidence supports deliverability or automation claims.
Fix the 142 JSON-LD issues first, then readability, robots.txt, sitemap and feed discovery problems that prevent those proof assets from travelling cleanly.
Give comparison publishers current facts, precise product boundaries and primary supporting URLs instead of generic positioning copy.
Days 61–90 — Test whether the evidence travels
Re-run the same prompts on all four providers and record whether gains come from broader presence, a stronger average position or a larger share of the answer.
For brands concentrated in Google AI, test whether ChatGPT and Claude can retrieve equivalent first-party and independent evidence.
Update the external pages that already receive citations before pitching dozens of unrelated new lists.
Keep the measurement unit fixed: intent × provider × evidence source. Treat the overall average as the summary, never the diagnosis.
Want this scoreboard for your own brand?
Run a free audit at tryera.ai/free-report — 30 minutes, your numbers, no deck required.
Full report with source data: Mailboxes providers for cold outreach.