September 17, 2026
September 17, 2026
How iGaming Brands Rank in AI Search: Operators, Suppliers and the Sources Behind Recommendations
Era’s iGaming report reveals several distinct contests for AI visibility: operator comparisons, platform selection, industry research and the sources cited along the way. Provider gaps and specialist results show why one overall ranking is an incomplete guide to where a brand can compete.
Era’s iGaming report reveals several distinct contests for AI visibility: operator comparisons, platform selection, industry research and the sources cited along the way. Provider gaps and specialist results show why one overall ranking is an incomplete guide to where a brand can compete.
An iGaming brand can compete for a player choosing an app, an operator evaluating a platform, or a team buying market intelligence. Each decision creates a different opportunity to appear in an AI answer. Era’s iGaming report brings these journeys together through brand visibility, Share of Voice, position, provider comparisons, search queries and citations. Its most useful findings emerge when those measurements are read together without treating them as interchangeable.
The first strategic decision is which recommendation your brand needs to enter.
SOFTSWISS occupies the report’s first podium position. Covers, in third, has higher headline Visibility and an earlier average Rank. Meanwhile, the Share of Voice chart is headed by betting operators. These are different competitive views of an industry whose buying journeys extend well beyond choosing a sportsbook.
1. The scoreboard: podium placement does not equal visibility leadership
SOFTSWISS records 14.0% Visibility, 1.7% Share of Voice and 2.2 average Rank on the podium page. Covers records 15.7%, 2.2% and 1.9, respectively. SOFTSWISS has 50 citations, compared with 27 for Covers.
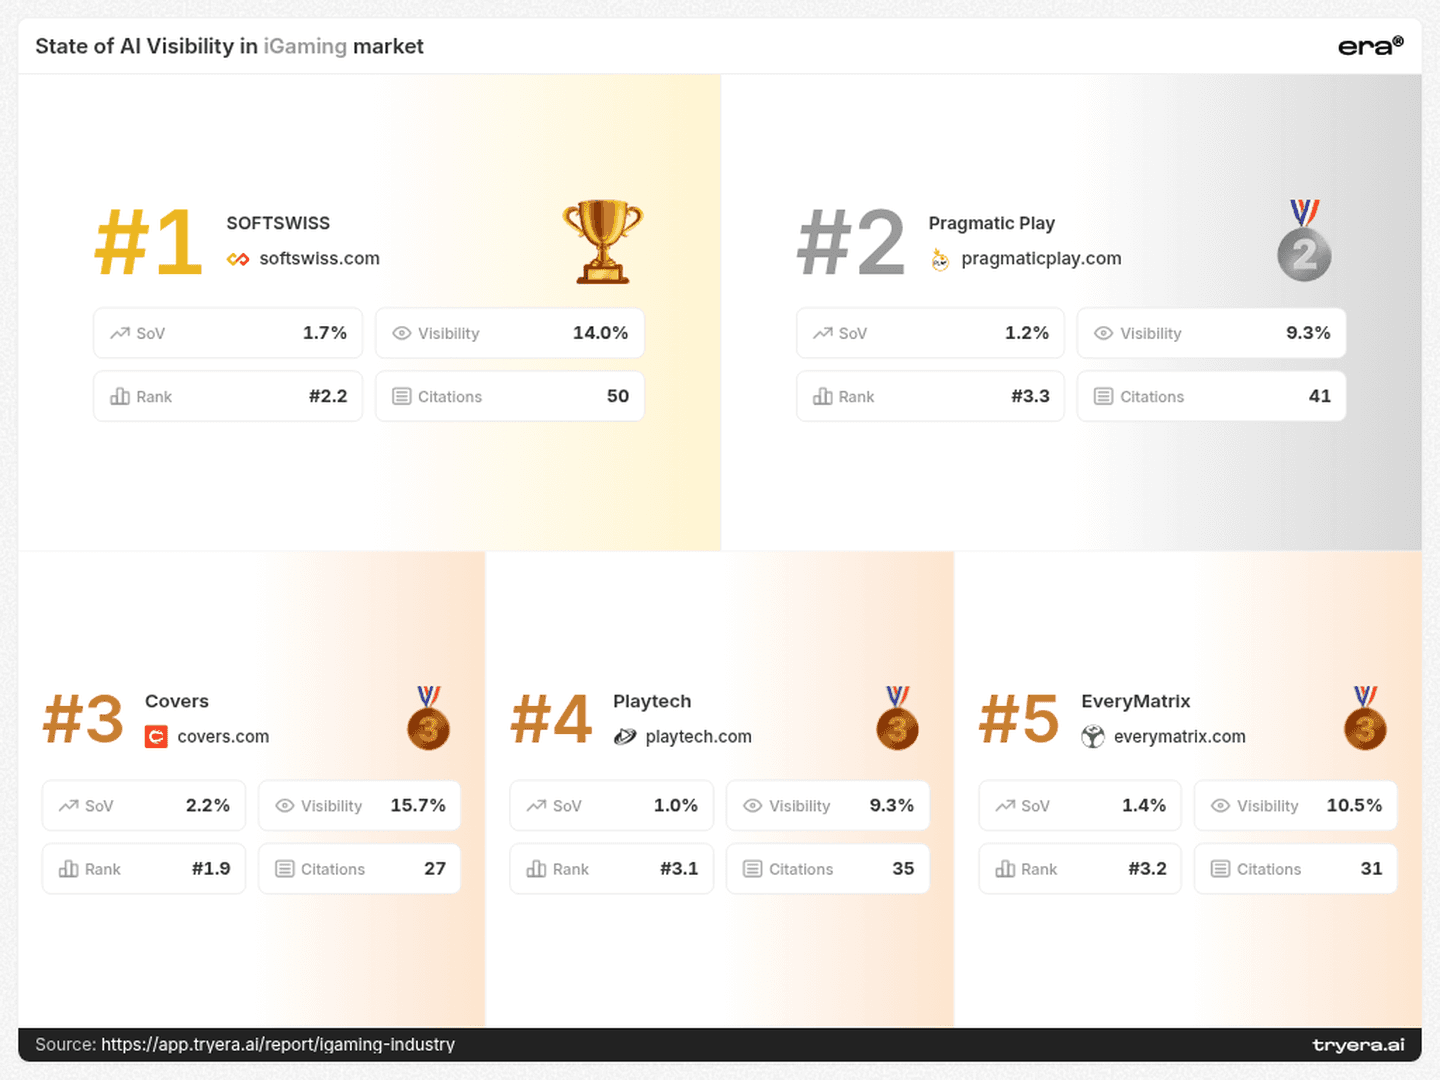
Covers appears in a larger share of monitored answers and earlier on average, while SOFTSWISS has the higher displayed citation count. The podium order should therefore be kept separate from any claim about leadership on an individual metric.
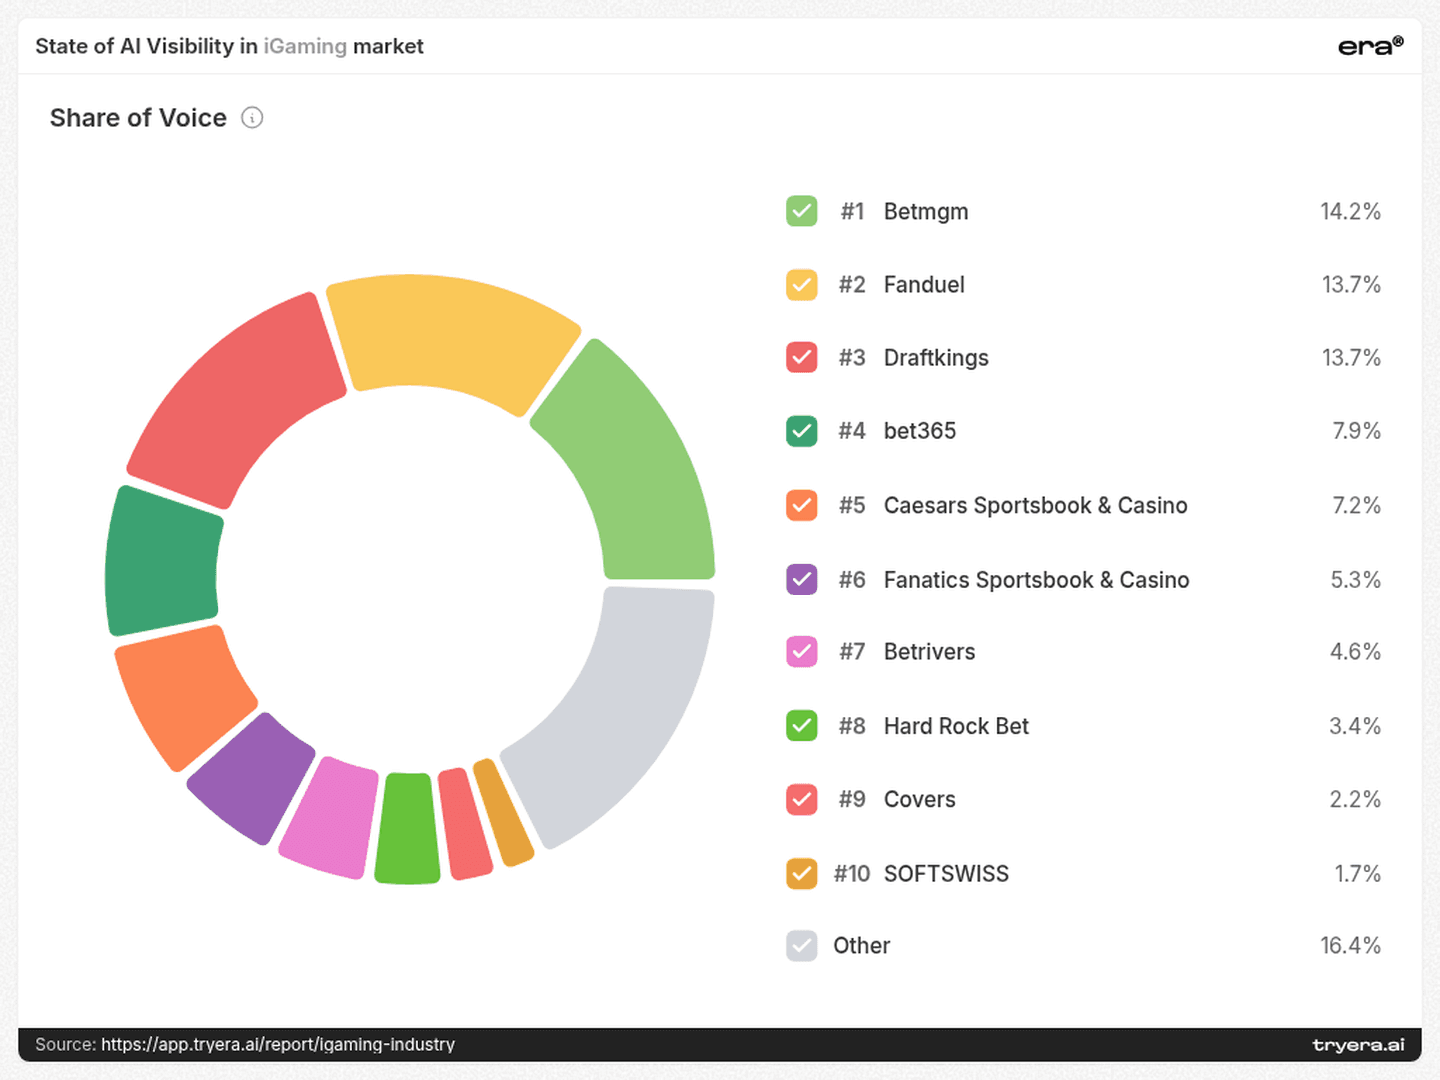
The separate Share of Voice chart places BetMGM, FanDuel and DraftKings at the top. That operator-heavy view asks a different business question from a comparison of platform suppliers.
For an operator, app-selection competitors belong in the benchmark. For a platform supplier, procurement questions deserve their own competitor set. Treating both as a single acquisition contest can direct content investment toward the wrong audience.
A useful AI benchmark starts with the decision your buyer is making.
2. Buyer intent: the market includes research purchases and segmentation tools
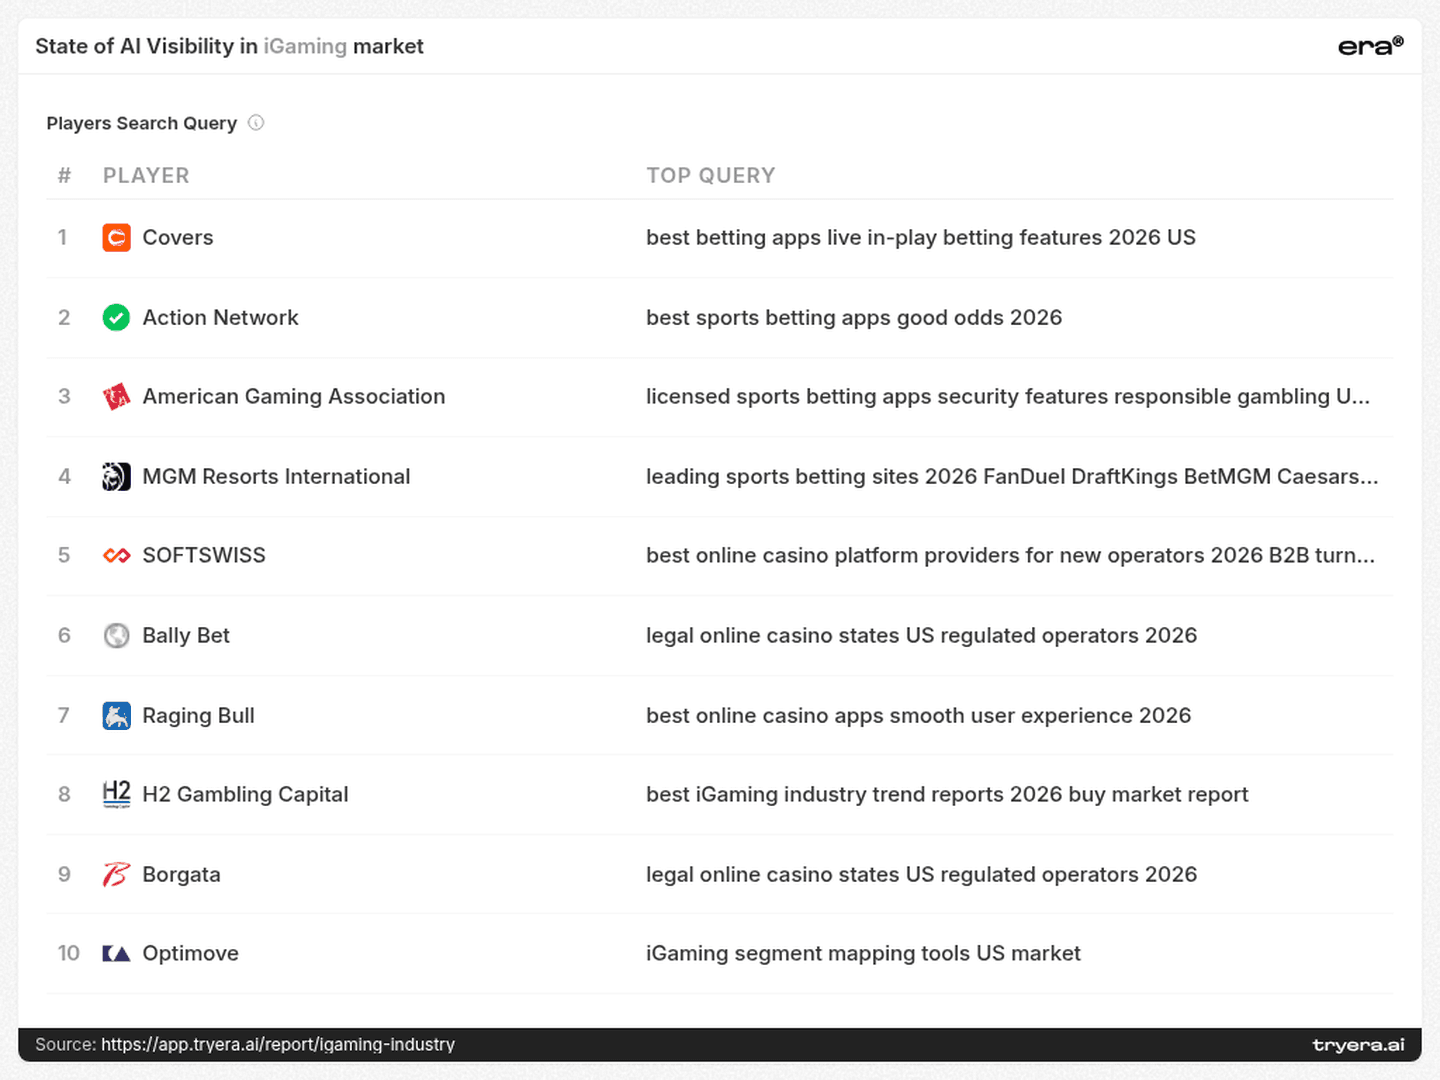
The query page makes that separation tangible. Covers is associated with “best betting apps live in-play betting features 2026 US.” H2 Gambling Capital is associated with “best iGaming industry trend reports 2026 buy market report.” Optimove’s query is “iGaming segment mapping tools US market.”
These are distinct tasks: comparing app features, purchasing research and finding analytical tools. A research provider or specialist software company has a relevant place in this landscape even when it is not competing for a consumer’s next betting account.
Bally Bet and Borgata share the exact displayed query “legal online casino states US regulated operators 2026.” That is a concrete starting point for comparing which evidence each brand supplies about availability. It does not establish that both brands perform equally on that query.
Build separate monitoring groups for app features, operator availability, supplier selection and business intelligence. Assign each a relevant destination page and a clear answer to the buyer’s question.
3. Provider gaps: one engine can hide another engine’s opportunity
Covers’ report-wide Visibility is 28.0% on ChatGPT and 20.0% on Perplexity, compared with 4.5% on Google AI and 4.0% on Claude. SOFTSWISS reaches 22.0% on Perplexity, versus 10.0% on ChatGPT.
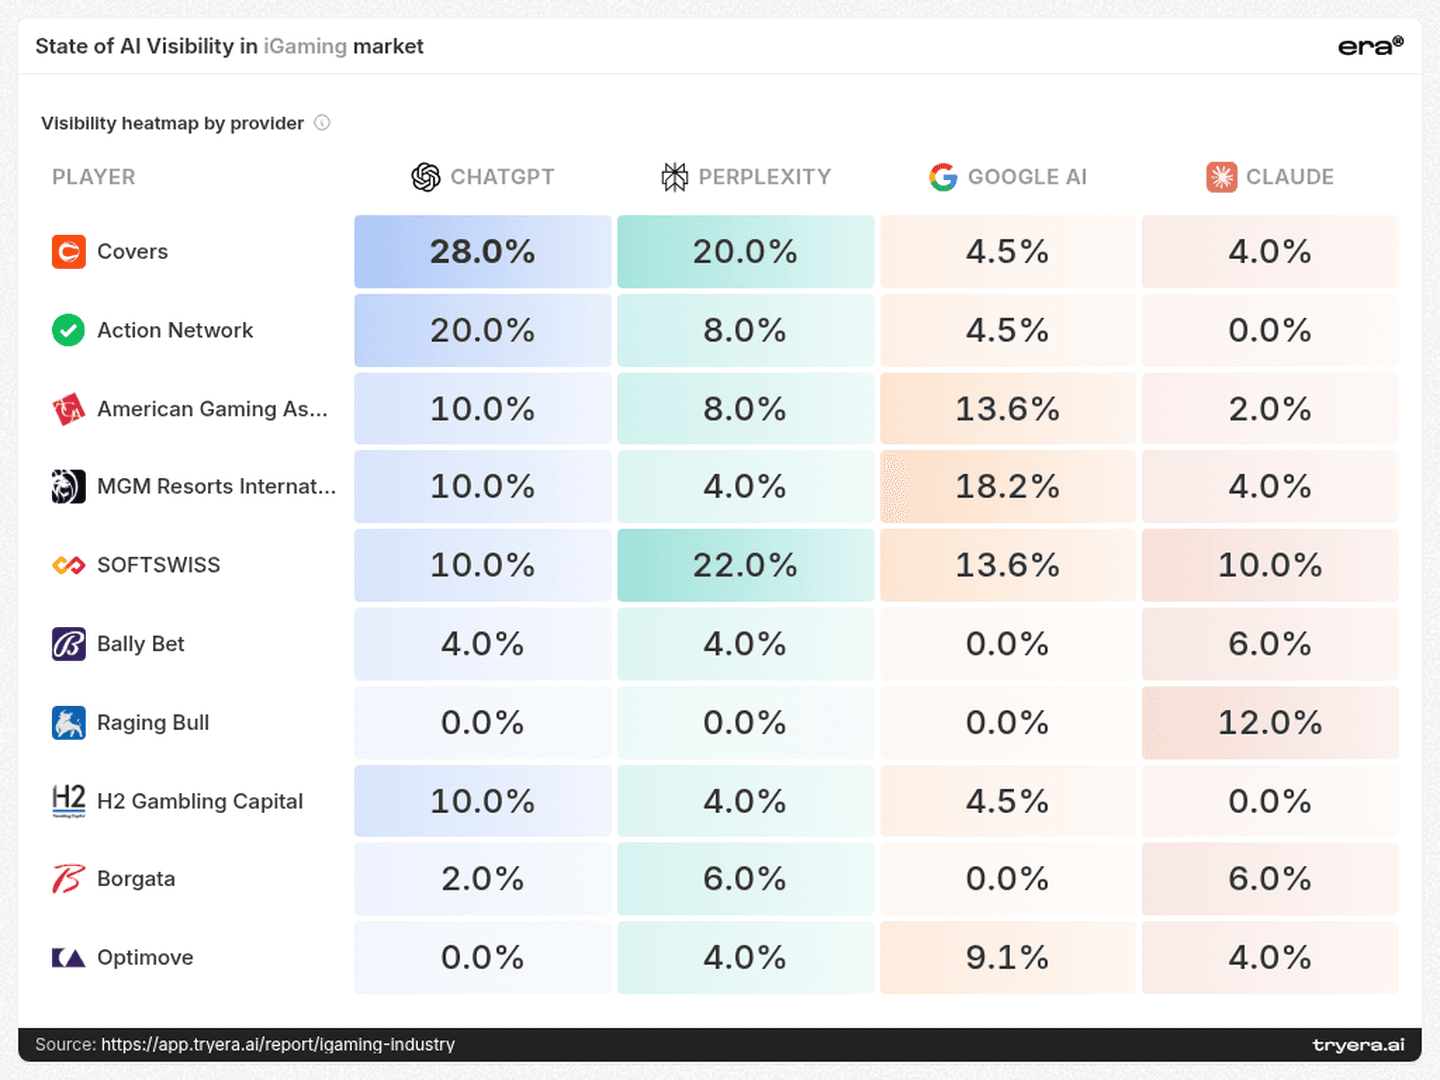
Optimove presents a different pattern: 9.1% on Google AI, 4.0% on Perplexity, 4.0% on Claude and 0.0% on ChatGPT. Its overall presence cannot be assessed adequately by checking ChatGPT alone.
These percentages describe each brand across the report’s monitored answers for that provider. They are not measurements of the individual queries listed above. The practical next step is to rerun the relevant buyer questions across engines and inspect the answers and cited evidence behind the gaps.
For a specialist supplier, a missing mention on one engine is a specific investigation. It should not automatically trigger a rewrite of an entire content strategy.
4. Specialist presence: limited reach can coexist with an early position
H2 Gambling Capital has 4.7% Visibility and 1.0 average Rank in the other-players table. Optimove has 3.5% Visibility and 1.2 average Rank. Both appear relatively early when present, despite appearing in a limited share of monitored answers.

The same table shows BetConstruct at 9.9% Visibility and 4.3 average Rank. Broader appearance and earlier placement are separate objectives: one brand may need coverage across more relevant questions, while another needs stronger differentiation within answers where it already appears.
Read alongside H2’s research-purchase query and Optimove’s segmentation query, these results identify specialist journeys worth investigating. They do not prove that either company leads every answer in its niche.
Measure whether you appear and where you appear as separate outcomes.
5. Sources: review pages are part of the competitive environment
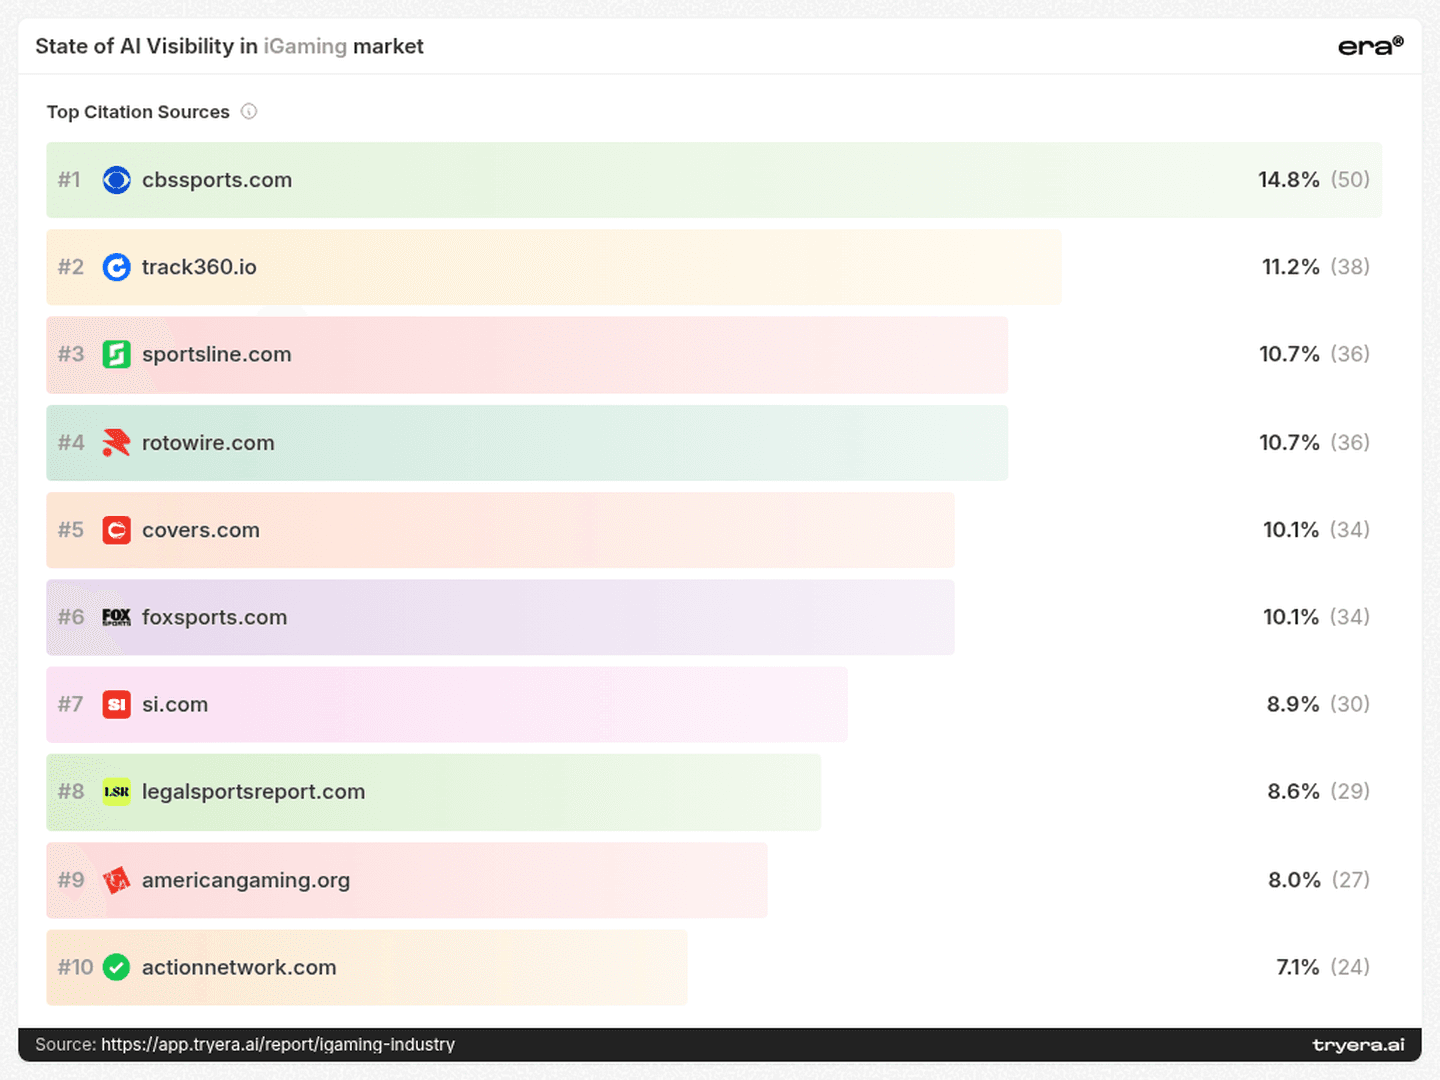
The citation-source page lists 50 citations for CBS Sports, 38 for track360.io and 34 for Covers. The presence of track360.io near the top makes it a source worth inspecting alongside the more immediately recognisable publishers.
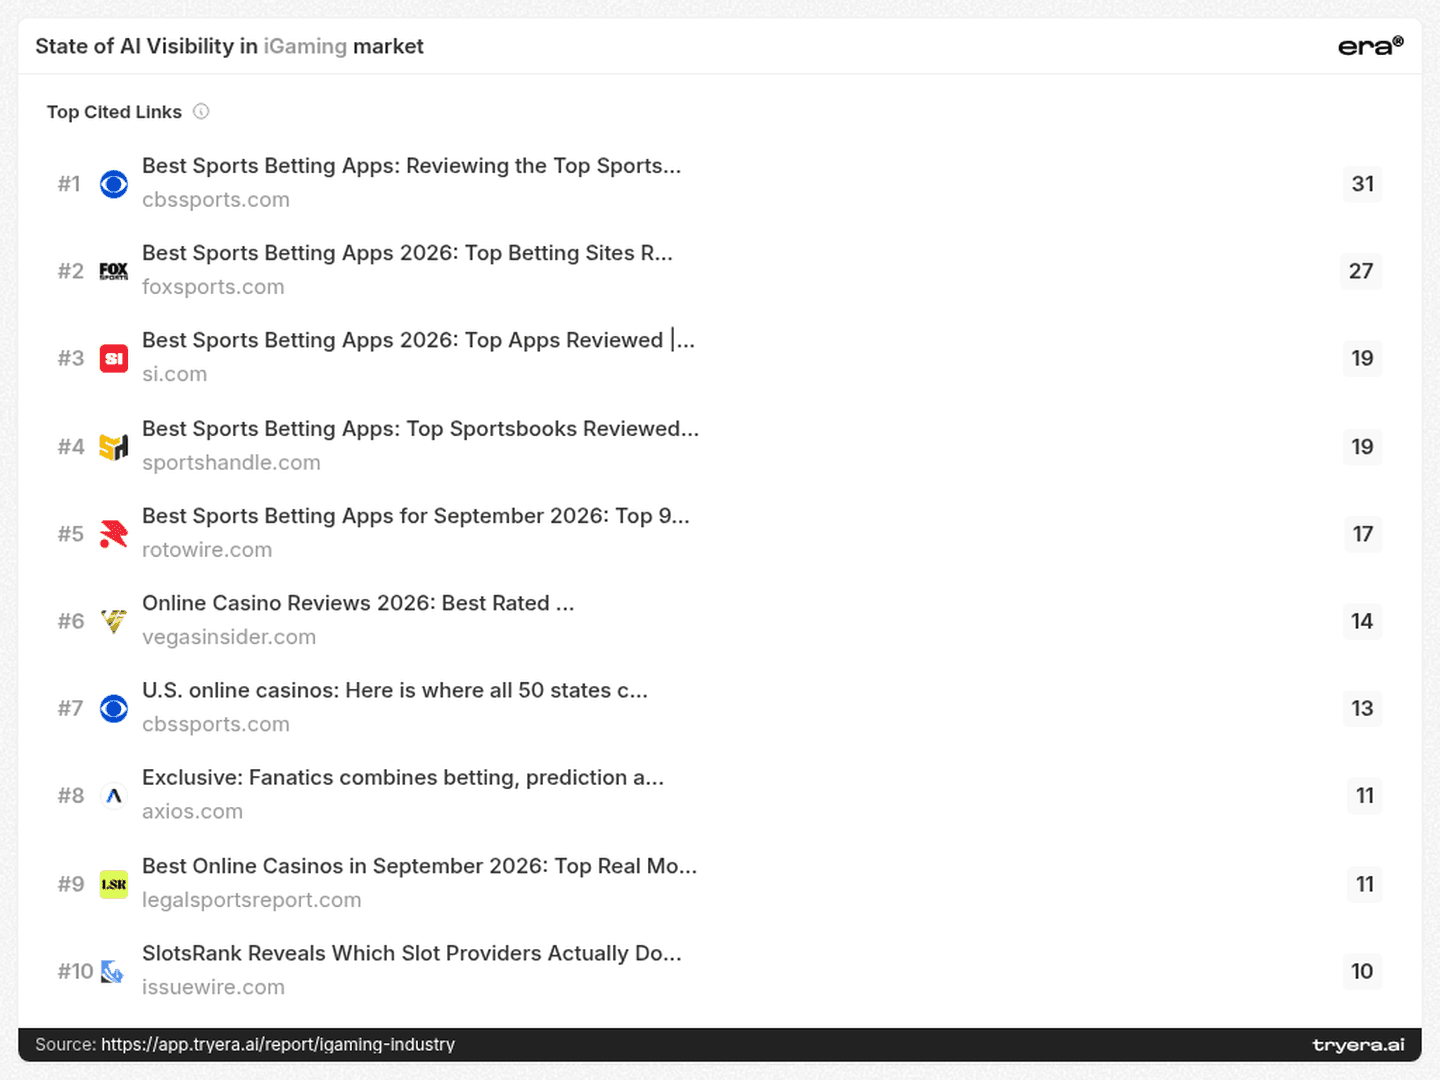
The cited-links page gives a more specific editorial signal. Its first five entries are sports-betting-app review or comparison pages. The CBS Sports entry records 31 citations and the FOX Sports entry 27.
For an operator, the work extends beyond improving its own product page. Audit how the brand’s features, availability and limitations are represented in the review pages appearing in relevant answers. Record omissions and outdated claims before deciding which corrections or supporting evidence to prepare.
For a supplier, consumer review lists may be the wrong target. Start with the sources actually returned for procurement questions. The report’s source landscape is a discovery list; relevance still needs to be checked at the question and page level.
6. Citation mix: owned evidence matters, but it is only part of the picture
H2 Gambling Capital’s citation mix is 32.5% own domain, 2.4% social and 65.1% other sources. SOFTSWISS records 14.1%, 2.5% and 83.4%, respectively. Covers records 16.4%, 1.8% and 81.8%.
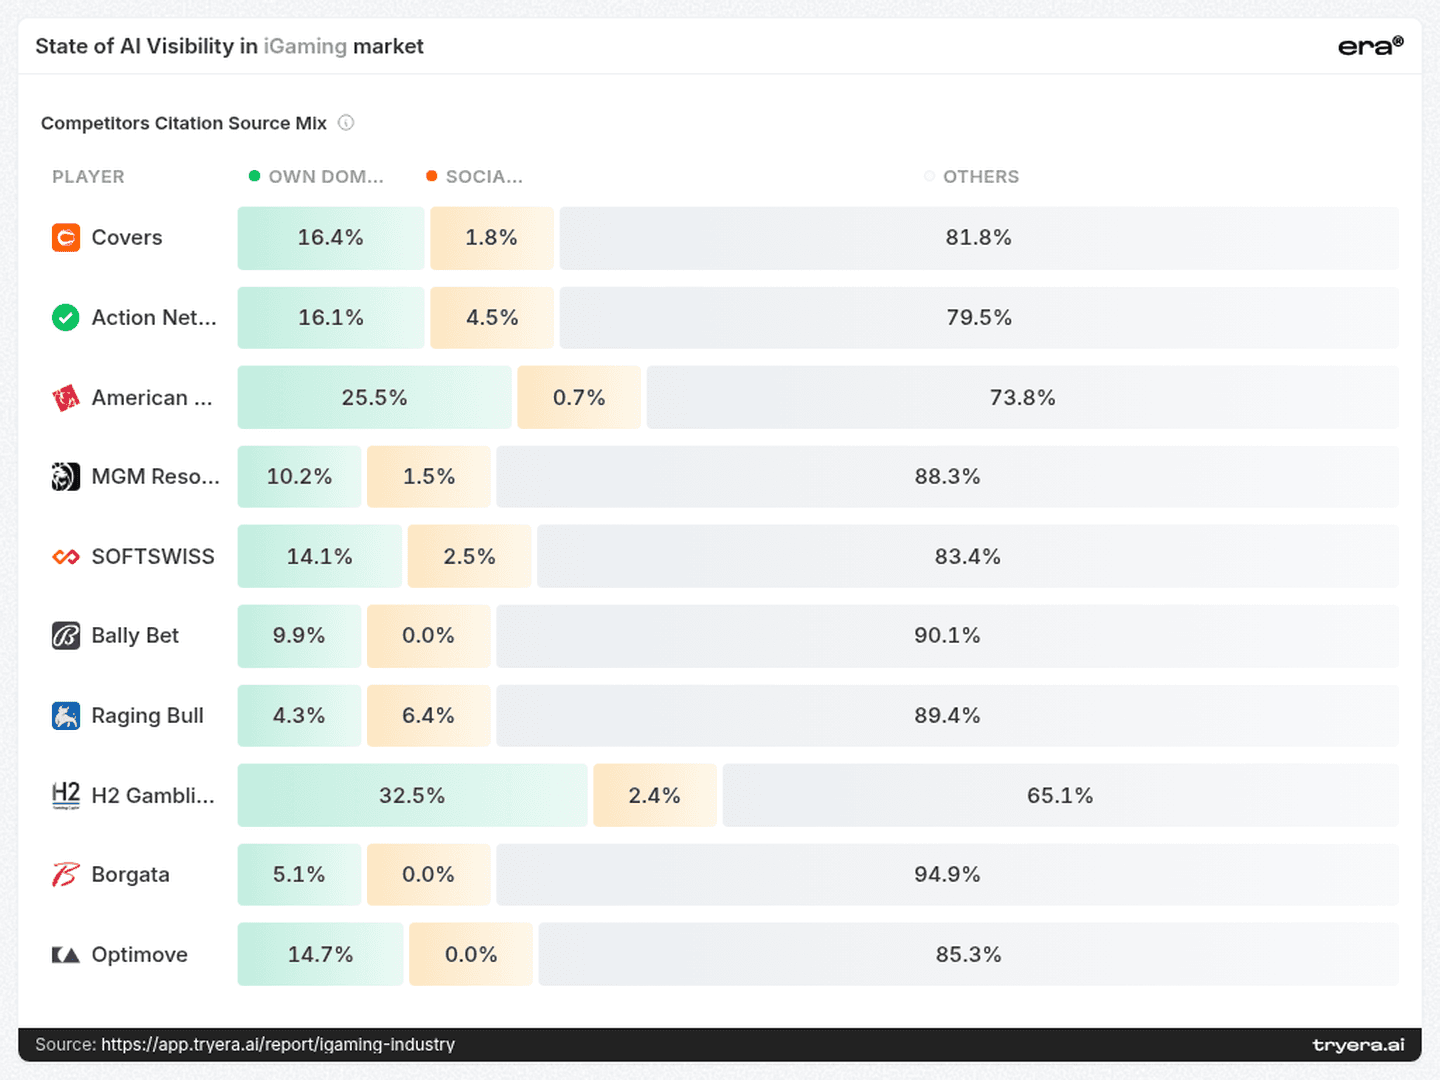
H2 has a larger owned-domain share in this comparison, yet other sources still account for most of its mix. Publishing useful evidence on your own site and checking how that evidence is represented elsewhere are complementary tasks.
The “other sources” category should not be treated as a guarantee of independent validation. Review the underlying pages for authorship, provenance and what they actually substantiate before describing them as corroboration.
For research businesses, useful owned evidence might include clear report scope, definitions and accessible summaries. For platform suppliers, it might include integration documentation and specific product capabilities. The relevant test is whether a page can support the buyer’s actual question.
7. Foundations: technical findings and link scale require different responses
The competitive-landscape page lists 306 issues, including 126 missing or invalid structured-data findings, 74 content-readability findings and 32 crawler-access-rule findings.
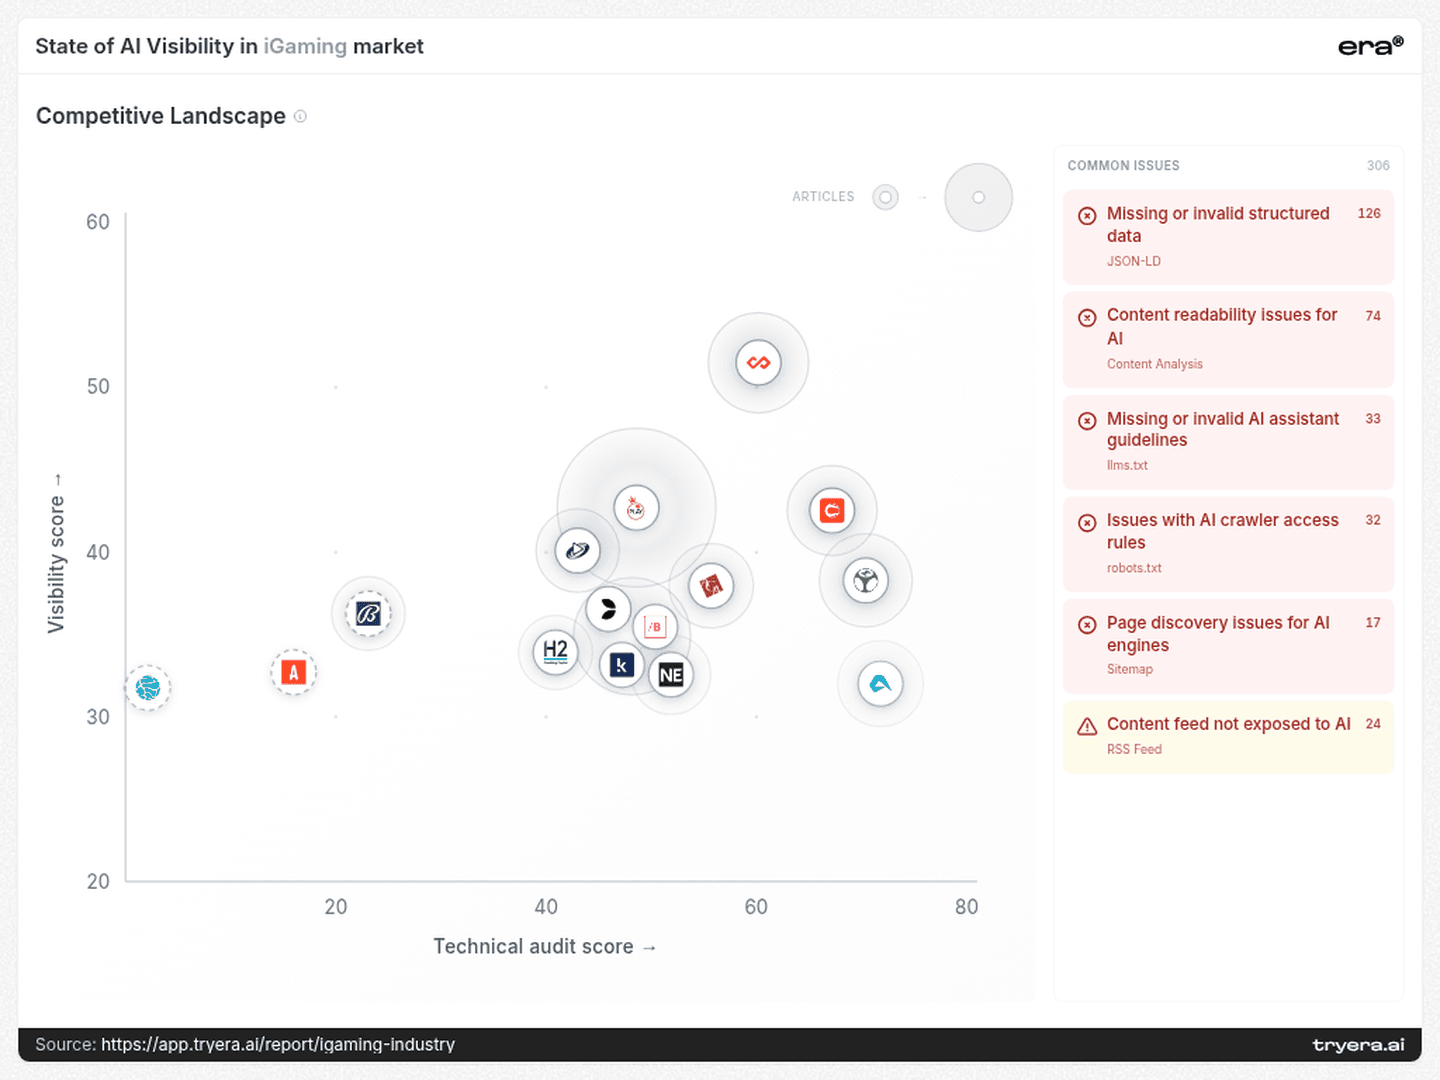
These counts provide an audit queue. Check which findings affect commercially relevant pages, whether the flagged condition is real, and whether the fix is appropriate. A repaired technical issue is a verified maintenance result; improved AI visibility must be measured separately.
The backlinks page shows another dimension of scale: 301.1M backlinks for bet365, compared with 22.6M for FanDuel and 2.1M for DraftKings.
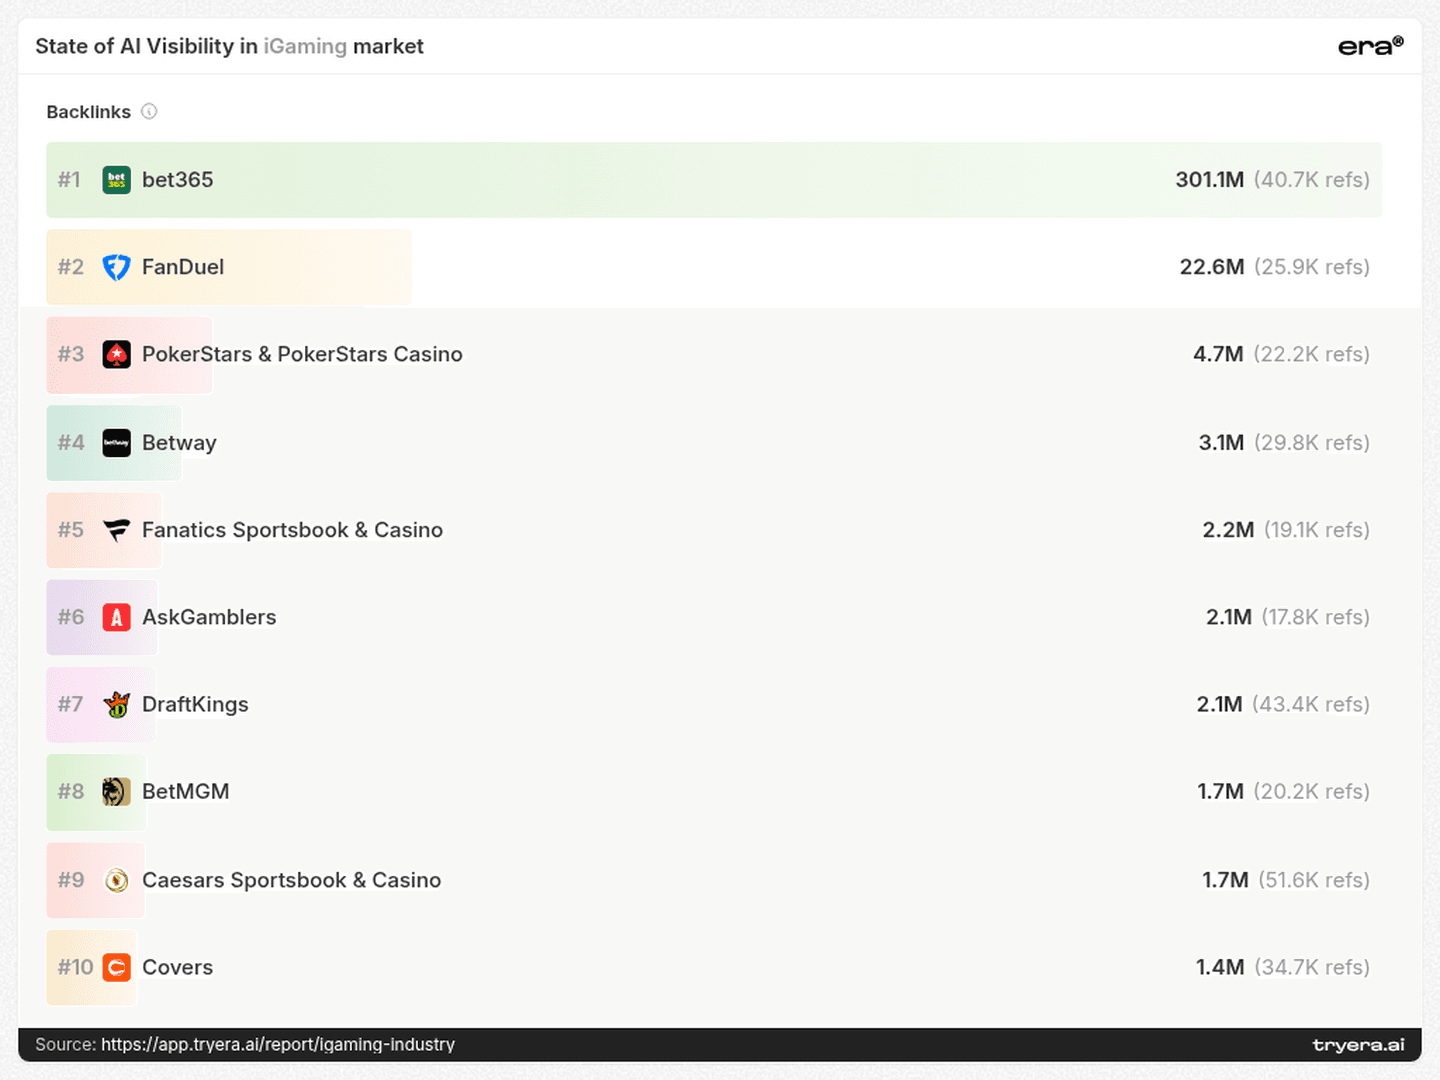
A bulk backlink target is a poor substitute for deciding which relevant sources should accurately describe your business. Use backlink analysis to investigate source relationships, while using answer-level citations to check which pages actually participate in the monitored recommendations.
8. The next 90 days: turn the findings into a testable programme
The search-volume page adds a useful reminder about the questions around product selection. It lists 1.8K for “sports betting apps,” 1.2K for “deposit limits,” 787 for “loss limits” and 513 for “self exclusion” in its monthly AI-search-demand estimates.
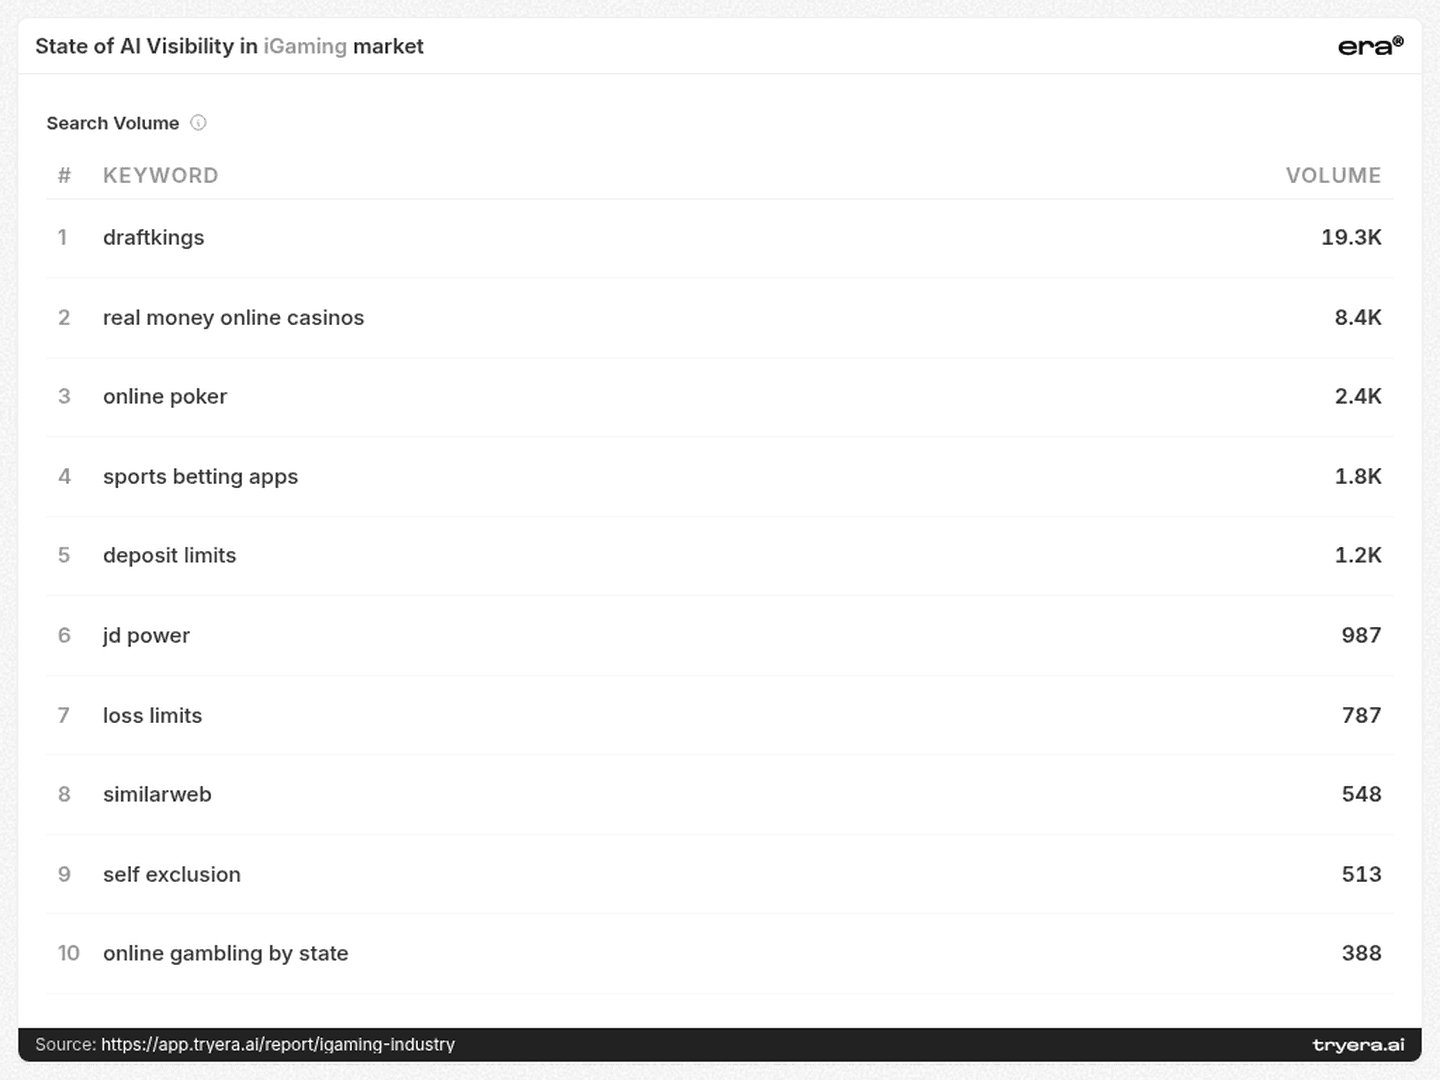
Those terms give operators concrete service and product-information topics to investigate alongside comparison content. They do not establish the intent of every searcher or predict conversions.
Days 1–30: define the questions and establish the baseline. Select the intent groups relevant to your business. Run the same questions across the four providers shown in the report. Record mentions, average position and cited pages separately. For each missing mention, identify whether the answer favours an operator, a publisher or a specialist. Keep brand entities separate unless overlapping records can be reliably reconciled.
Days 31–60: repair the evidence buyers need. Choose a small set of priority pages. For operators, verify feature explanations, availability information and instructions for account controls. For suppliers or research firms, clarify product scope, integrations, report coverage and evidence supporting comparisons. Validate relevant structured data and crawler access. Prepare factual corrections where cited third-party pages misrepresent the business.
Days 61–90: repeat the same comparisons. Recheck the original questions and provider gaps. Record whether the brand enters more relevant answers, appears earlier, or gains citations to the improved pages. Keep a change log so the next editorial decision is based on observed results rather than a single overall score.
The objective is a clearer presence in the decisions your business can serve, with evidence that can be checked at the question, source and provider level.
Want this scoreboard for your own brand? Run a free audit at tryera.ai/free-report — 30 minutes, your numbers, no deck required.
Full report with source data: iGaming.



An iGaming brand can compete for a player choosing an app, an operator evaluating a platform, or a team buying market intelligence. Each decision creates a different opportunity to appear in an AI answer. Era’s iGaming report brings these journeys together through brand visibility, Share of Voice, position, provider comparisons, search queries and citations. Its most useful findings emerge when those measurements are read together without treating them as interchangeable.
The first strategic decision is which recommendation your brand needs to enter.
SOFTSWISS occupies the report’s first podium position. Covers, in third, has higher headline Visibility and an earlier average Rank. Meanwhile, the Share of Voice chart is headed by betting operators. These are different competitive views of an industry whose buying journeys extend well beyond choosing a sportsbook.
1. The scoreboard: podium placement does not equal visibility leadership
SOFTSWISS records 14.0% Visibility, 1.7% Share of Voice and 2.2 average Rank on the podium page. Covers records 15.7%, 2.2% and 1.9, respectively. SOFTSWISS has 50 citations, compared with 27 for Covers.
Covers appears in a larger share of monitored answers and earlier on average, while SOFTSWISS has the higher displayed citation count. The podium order should therefore be kept separate from any claim about leadership on an individual metric.
The separate Share of Voice chart places BetMGM, FanDuel and DraftKings at the top. That operator-heavy view asks a different business question from a comparison of platform suppliers.
For an operator, app-selection competitors belong in the benchmark. For a platform supplier, procurement questions deserve their own competitor set. Treating both as a single acquisition contest can direct content investment toward the wrong audience.
A useful AI benchmark starts with the decision your buyer is making.
2. Buyer intent: the market includes research purchases and segmentation tools
The query page makes that separation tangible. Covers is associated with “best betting apps live in-play betting features 2026 US.” H2 Gambling Capital is associated with “best iGaming industry trend reports 2026 buy market report.” Optimove’s query is “iGaming segment mapping tools US market.”
These are distinct tasks: comparing app features, purchasing research and finding analytical tools. A research provider or specialist software company has a relevant place in this landscape even when it is not competing for a consumer’s next betting account.
Bally Bet and Borgata share the exact displayed query “legal online casino states US regulated operators 2026.” That is a concrete starting point for comparing which evidence each brand supplies about availability. It does not establish that both brands perform equally on that query.
Build separate monitoring groups for app features, operator availability, supplier selection and business intelligence. Assign each a relevant destination page and a clear answer to the buyer’s question.
3. Provider gaps: one engine can hide another engine’s opportunity
Covers’ report-wide Visibility is 28.0% on ChatGPT and 20.0% on Perplexity, compared with 4.5% on Google AI and 4.0% on Claude. SOFTSWISS reaches 22.0% on Perplexity, versus 10.0% on ChatGPT.
Optimove presents a different pattern: 9.1% on Google AI, 4.0% on Perplexity, 4.0% on Claude and 0.0% on ChatGPT. Its overall presence cannot be assessed adequately by checking ChatGPT alone.
These percentages describe each brand across the report’s monitored answers for that provider. They are not measurements of the individual queries listed above. The practical next step is to rerun the relevant buyer questions across engines and inspect the answers and cited evidence behind the gaps.
For a specialist supplier, a missing mention on one engine is a specific investigation. It should not automatically trigger a rewrite of an entire content strategy.
4. Specialist presence: limited reach can coexist with an early position
H2 Gambling Capital has 4.7% Visibility and 1.0 average Rank in the other-players table. Optimove has 3.5% Visibility and 1.2 average Rank. Both appear relatively early when present, despite appearing in a limited share of monitored answers.
The same table shows BetConstruct at 9.9% Visibility and 4.3 average Rank. Broader appearance and earlier placement are separate objectives: one brand may need coverage across more relevant questions, while another needs stronger differentiation within answers where it already appears.
Read alongside H2’s research-purchase query and Optimove’s segmentation query, these results identify specialist journeys worth investigating. They do not prove that either company leads every answer in its niche.
Measure whether you appear and where you appear as separate outcomes.
5. Sources: review pages are part of the competitive environment
The citation-source page lists 50 citations for CBS Sports, 38 for track360.io and 34 for Covers. The presence of track360.io near the top makes it a source worth inspecting alongside the more immediately recognisable publishers.
The cited-links page gives a more specific editorial signal. Its first five entries are sports-betting-app review or comparison pages. The CBS Sports entry records 31 citations and the FOX Sports entry 27.
For an operator, the work extends beyond improving its own product page. Audit how the brand’s features, availability and limitations are represented in the review pages appearing in relevant answers. Record omissions and outdated claims before deciding which corrections or supporting evidence to prepare.
For a supplier, consumer review lists may be the wrong target. Start with the sources actually returned for procurement questions. The report’s source landscape is a discovery list; relevance still needs to be checked at the question and page level.
6. Citation mix: owned evidence matters, but it is only part of the picture
H2 Gambling Capital’s citation mix is 32.5% own domain, 2.4% social and 65.1% other sources. SOFTSWISS records 14.1%, 2.5% and 83.4%, respectively. Covers records 16.4%, 1.8% and 81.8%.
H2 has a larger owned-domain share in this comparison, yet other sources still account for most of its mix. Publishing useful evidence on your own site and checking how that evidence is represented elsewhere are complementary tasks.
The “other sources” category should not be treated as a guarantee of independent validation. Review the underlying pages for authorship, provenance and what they actually substantiate before describing them as corroboration.
For research businesses, useful owned evidence might include clear report scope, definitions and accessible summaries. For platform suppliers, it might include integration documentation and specific product capabilities. The relevant test is whether a page can support the buyer’s actual question.
7. Foundations: technical findings and link scale require different responses
The competitive-landscape page lists 306 issues, including 126 missing or invalid structured-data findings, 74 content-readability findings and 32 crawler-access-rule findings.
These counts provide an audit queue. Check which findings affect commercially relevant pages, whether the flagged condition is real, and whether the fix is appropriate. A repaired technical issue is a verified maintenance result; improved AI visibility must be measured separately.
The backlinks page shows another dimension of scale: 301.1M backlinks for bet365, compared with 22.6M for FanDuel and 2.1M for DraftKings.
A bulk backlink target is a poor substitute for deciding which relevant sources should accurately describe your business. Use backlink analysis to investigate source relationships, while using answer-level citations to check which pages actually participate in the monitored recommendations.
8. The next 90 days: turn the findings into a testable programme
The search-volume page adds a useful reminder about the questions around product selection. It lists 1.8K for “sports betting apps,” 1.2K for “deposit limits,” 787 for “loss limits” and 513 for “self exclusion” in its monthly AI-search-demand estimates.
Those terms give operators concrete service and product-information topics to investigate alongside comparison content. They do not establish the intent of every searcher or predict conversions.
Days 1–30: define the questions and establish the baseline. Select the intent groups relevant to your business. Run the same questions across the four providers shown in the report. Record mentions, average position and cited pages separately. For each missing mention, identify whether the answer favours an operator, a publisher or a specialist. Keep brand entities separate unless overlapping records can be reliably reconciled.
Days 31–60: repair the evidence buyers need. Choose a small set of priority pages. For operators, verify feature explanations, availability information and instructions for account controls. For suppliers or research firms, clarify product scope, integrations, report coverage and evidence supporting comparisons. Validate relevant structured data and crawler access. Prepare factual corrections where cited third-party pages misrepresent the business.
Days 61–90: repeat the same comparisons. Recheck the original questions and provider gaps. Record whether the brand enters more relevant answers, appears earlier, or gains citations to the improved pages. Keep a change log so the next editorial decision is based on observed results rather than a single overall score.
The objective is a clearer presence in the decisions your business can serve, with evidence that can be checked at the question, source and provider level.
Want this scoreboard for your own brand? Run a free audit at tryera.ai/free-report — 30 minutes, your numbers, no deck required.
Full report with source data: iGaming.