August 23, 2026
August 23, 2026
How Centralized Crypto Exchanges Rank in AI Search: A Deep Analysis of the Market Leaders
Coinbase appears in 70.4% of AI answers. Kraken still owns more of the conversation. The queries and sources explain where that gap comes from.
Coinbase appears in 70.4% of AI answers. Kraken still owns more of the conversation. The queries and sources explain where that gap comes from.
A buyer does not ask ChatGPT for a category leaderboard. They ask for an outcome: the safest exchange, the lowest total cost, the easiest place to start, or the best venue for liquidity. We ran 50 of those questions through ChatGPT, Perplexity, Google AI and Claude, then traced which brands entered the answers and which pages the models used as evidence. The result is not one ranking. It is a chain: user intent → retrieved source → brand mention → position in the answer.
Visibility gets you named. Citability decides how much of the answer you own.
01 / Intent
People do not search for exchanges. They search for outcomes.
Buyer jobs shape the prompt set — and each player has a different winning query
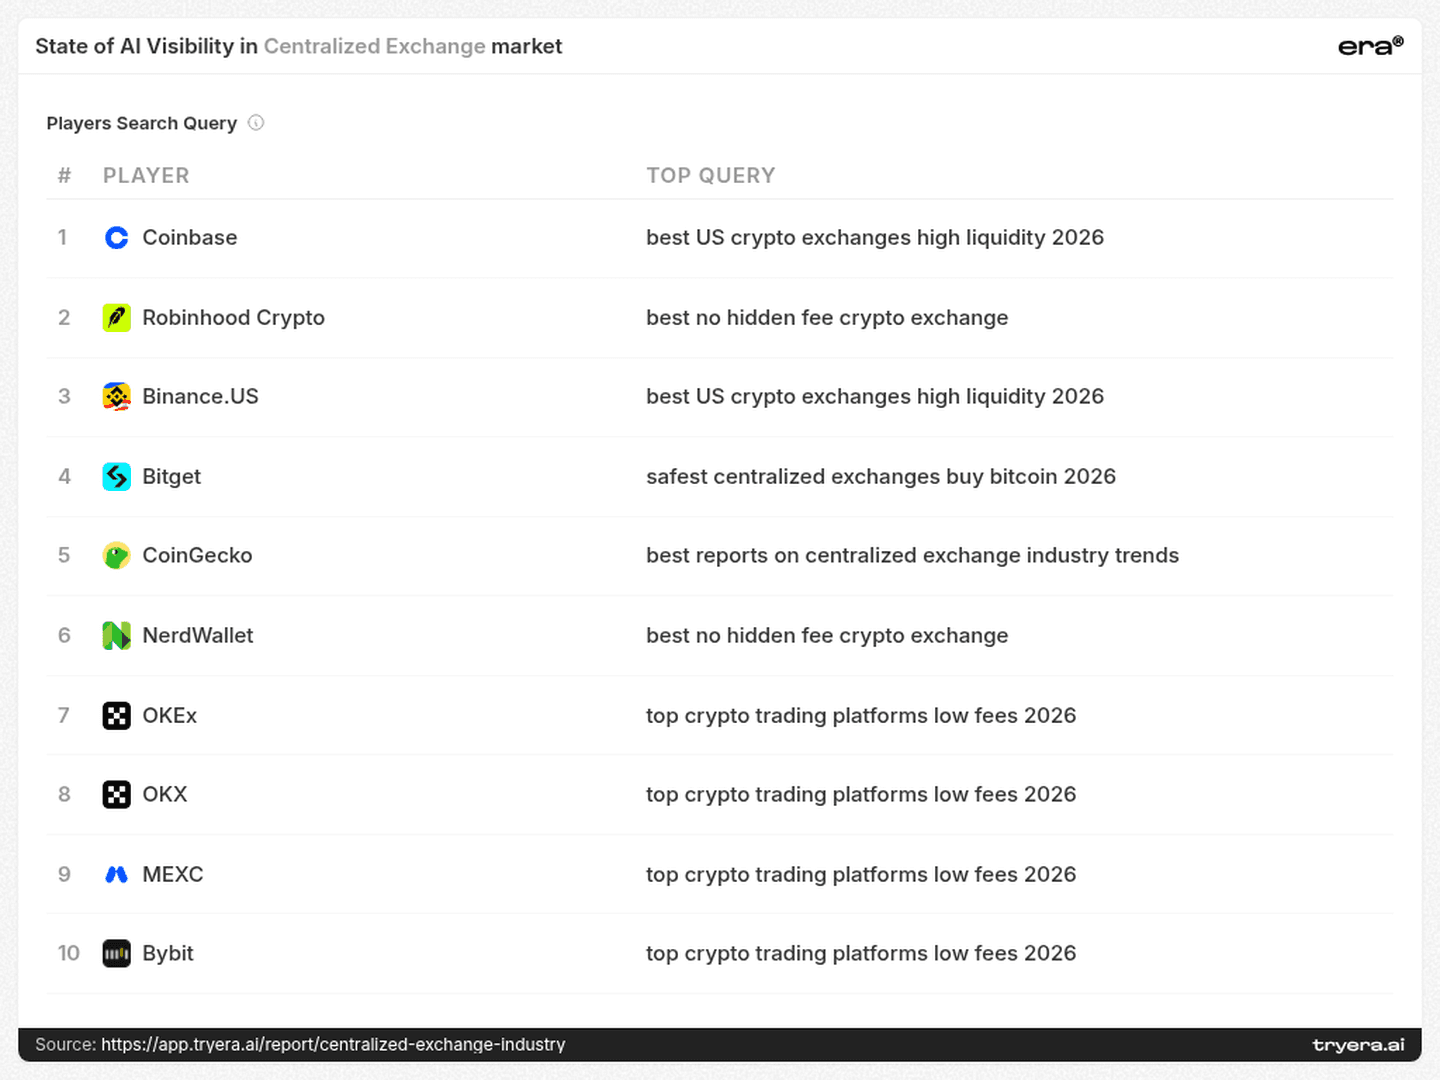
The official Era search-query page shows the top query for each visible player. This is not search-volume data.
Twelve questions are about safety, trust, compliance or storage. Eleven are about beginners and product experience. Nine are about fees and total cost. Another nine ask for reports, reviews or market intelligence. Six focus on liquidity, access or trading use cases, and three on support. In other words, 64% of the prompt set is about risk, cost or ease of use — not token count and not a generic “best exchange” claim.
“safest centralized exchanges to buy bitcoin”
“best no hidden fee crypto exchange”
“best US crypto exchanges high liquidity 2026”
“best crypto exchanges for beginners in the US”
The raw prompt table makes the category boundary problem visible. The test set moves between exchanges, brokers, mobile trading apps, newsletters, research tools, review platforms and fee-comparison services. Models are not deciding which company fits a neat CEX taxonomy; they are deciding which entity can complete the buyer’s job.
Coinbase and Binance.US are strongest around high-liquidity US queries. Robinhood Crypto and NerdWallet surface around the “no hidden fee” job. OKX, OKEx, MEXC and Bybit collide on low-fee trading-platform prompts. Bitget and Phemex win variants of the safety query. You do not win AI search by ranking for “crypto exchange”. You win a portfolio of narrow jobs.
02 / Reach vs depth
Coinbase wins reach. Kraken wins depth.
Two crowns: visibility and share of voice
Visibility asks whether the brand appears. Share of voice measures how much of the category conversation it occupies.
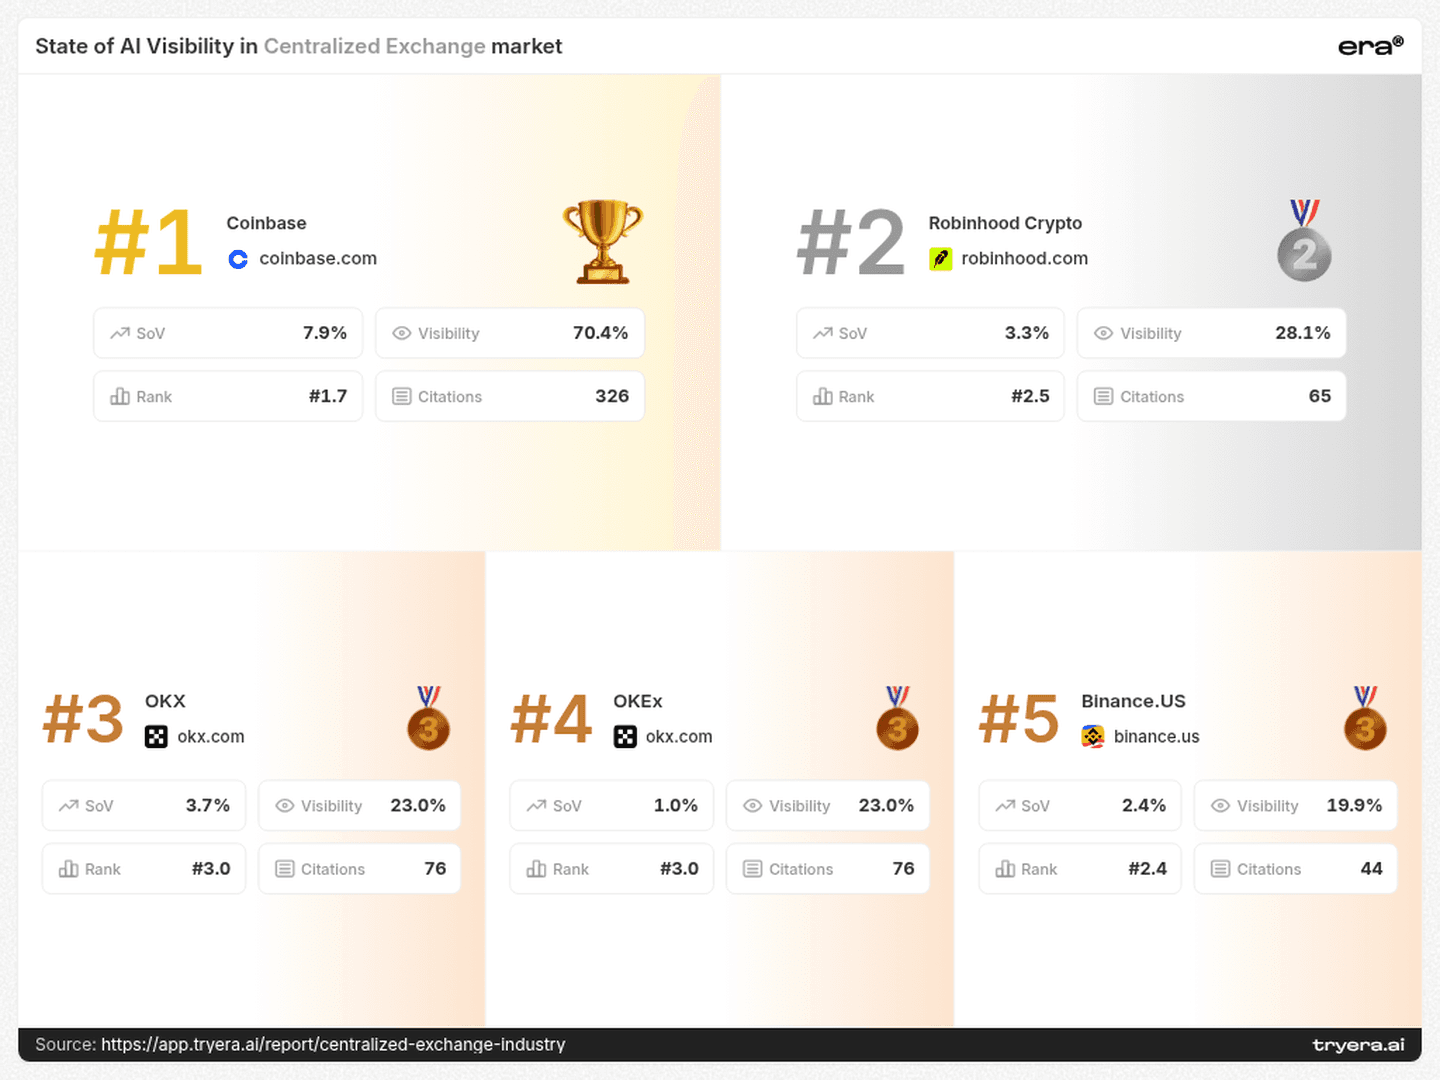
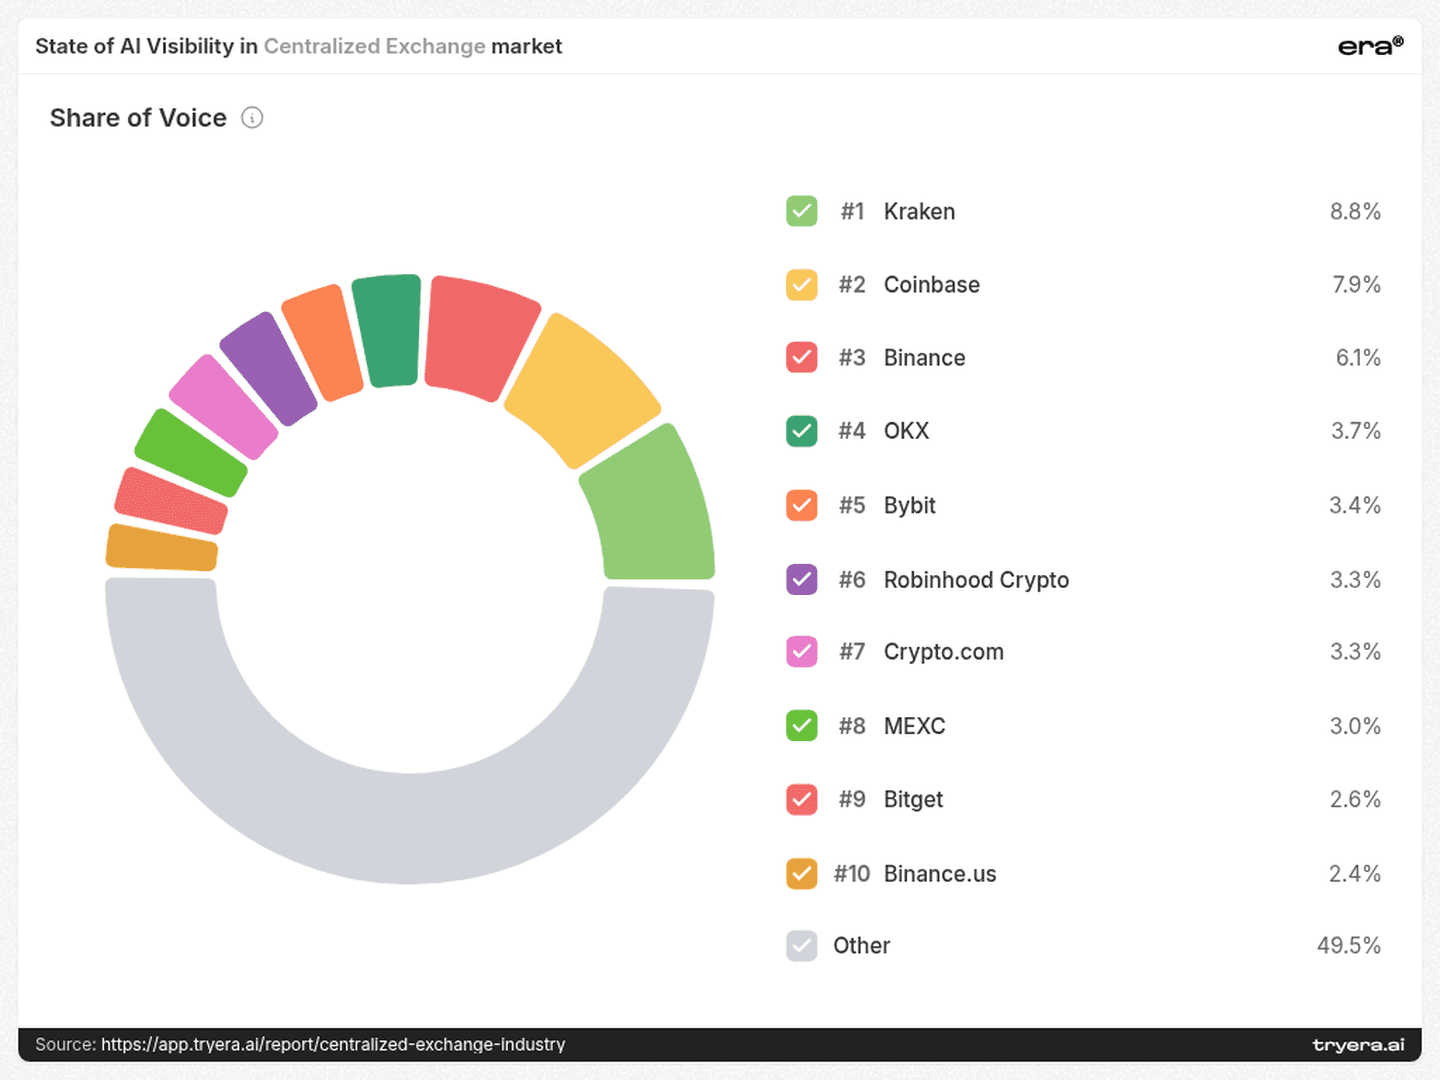
Coinbase appears in 70.4% of answers, with 326 citationsagainst an industry average of 34. But Kraken owns 8.8% share of voice, ahead of Coinbase at 7.9%. One company wins breadth; the other wins depth.
This is not a winner-take-all leaderboard. Kraken, Coinbase, Binance, OKX and Bybit — the top five by share of voice — add up to only 29.9%. The long tail labelled “Other” is larger than all five combined at 49.5%. A challenger does not need to beat Coinbase everywhere; it needs to become the defensible answer to one high-intent question.
Only 15.7% of Coinbase’s citation footprint comes from player-owned domains, while 76.8% comes from other sources. Kraken has a different advantage: kraken.com is the most-cited domain in the report. The data does not prove one causal story, but it shows two defensible routes into AI answers: become the default brand that many sources validate, or become a source models repeatedly retrieve.
03 / Engine gaps
Four engines produce four different markets.
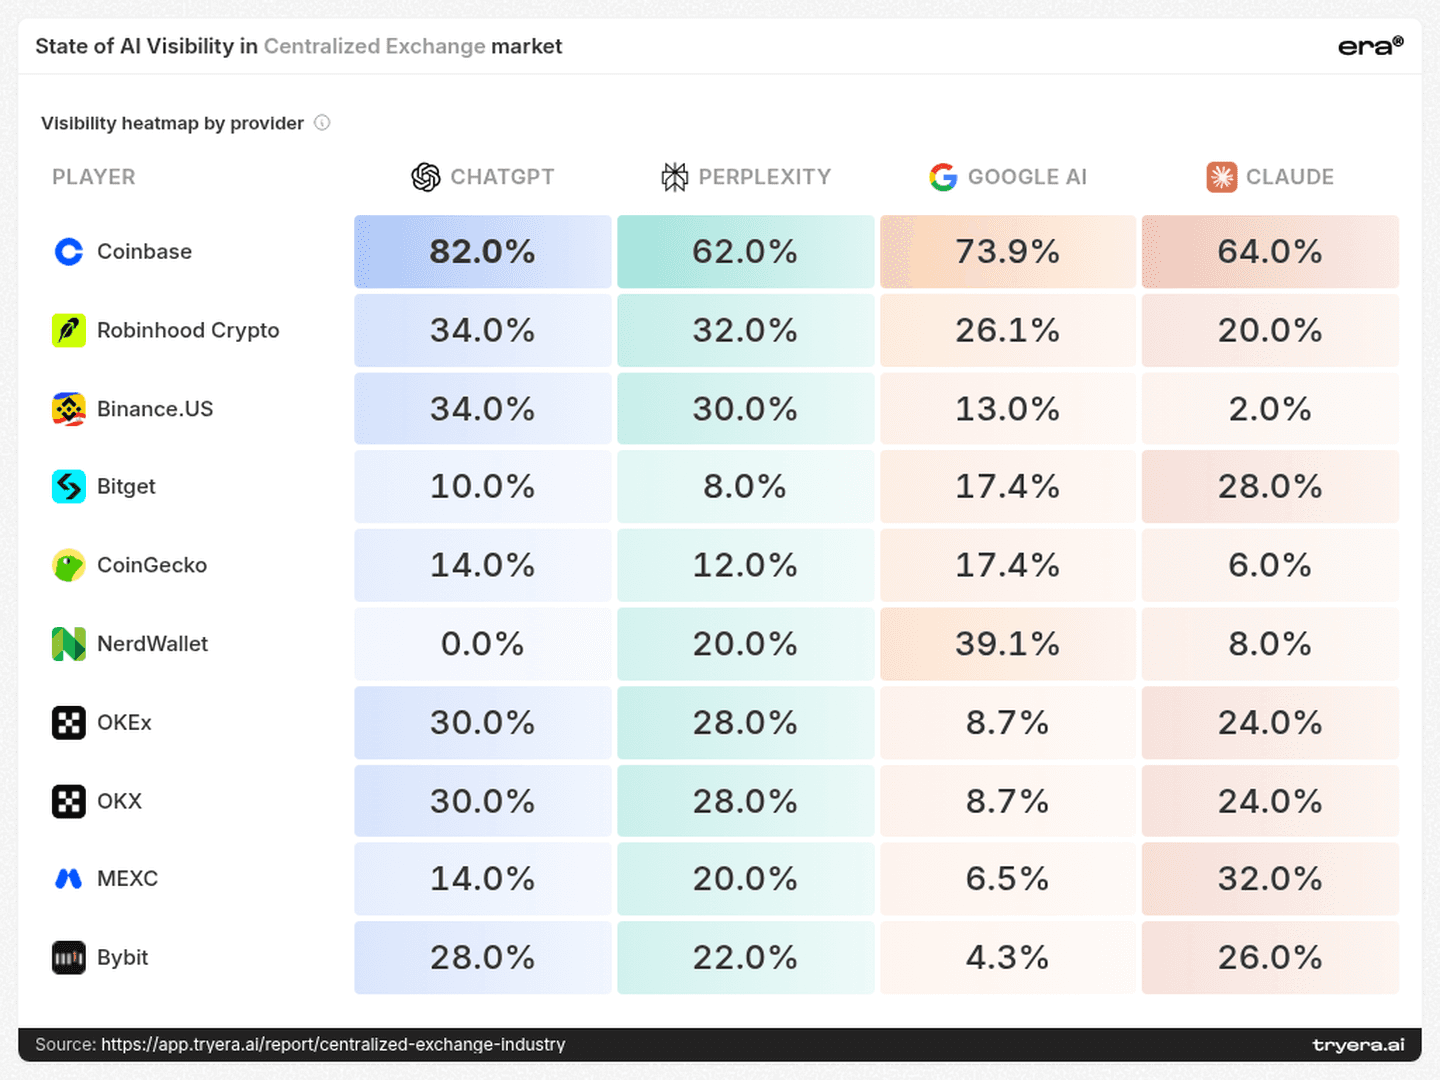
A blended visibility score can hide a provider failure
The same entity can be a leader on one engine and nearly absent on another.
0 → 39.1% — NerdWallet / ChatGPT → Google AI
6.5 → 32% — MEXC / Google AI → Claude
34 → 2% — Binance.US / ChatGPT → Claude
28 → 4.3% — Bybit / ChatGPT → Google AI
These are not rounding errors. They are different retrieval systems using different source graphs and ranking defaults. The useful unit of analysis is intent × model × source, not a single brand average. A Google AI gap points you toward the pages Google retrieves. A Claude gap requires a different source audit.
The winners are built in the citation layer.
04 / Sources
The evidence layer behind the leaderboard.
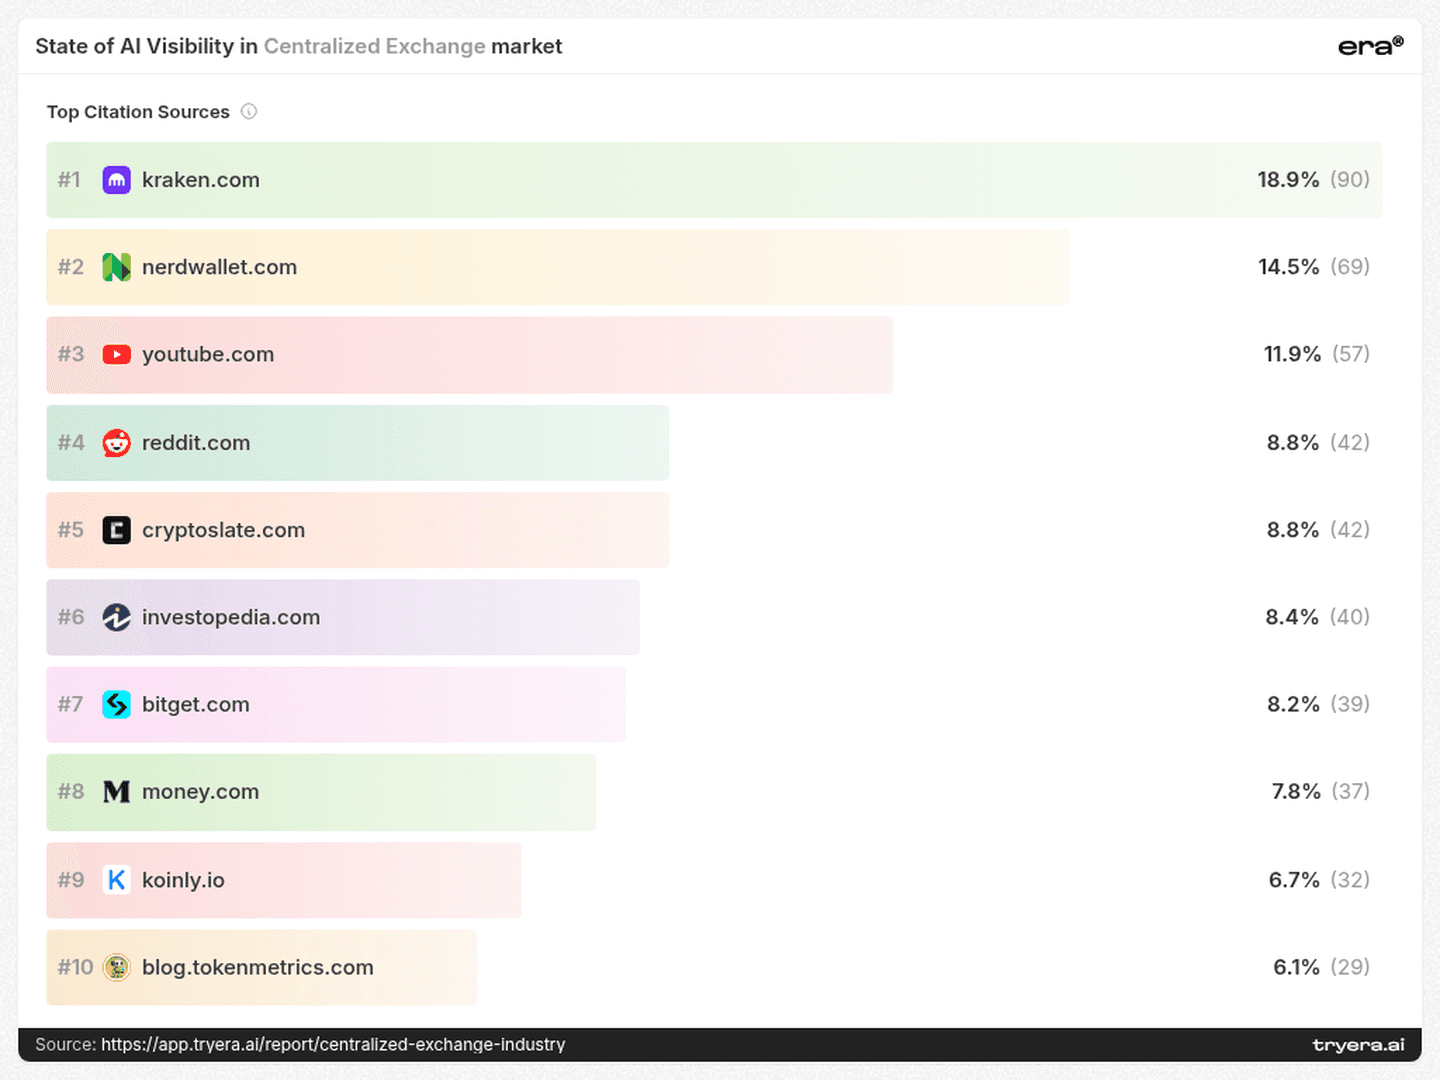
Top citation sources
Source shares shown in the public report; citation occurrences are distinct from the report’s count of unique sources.
kraken.com 90 / 18.9%
nerdwallet.com 69 / 14.5%
youtube.com 57 / 11.9%
reddit.com 42 / 8.8%
cryptoslate.com 42 / 8.8%
Kraken and NerdWallet occupy a rare position: they are players in the answer and sources behind the answer. A useful explainer can be retrieved across many prompts, repeatedly putting the same entity back into the evidence set. Yet even NerdWallet — the strongest owned-domain share shown at 24.1% — still gets 67% of its citations from third parties. Coinbase gets 76.8% from outside sources; Robinhood gets 78%. Their AI presence depends mainly on pages they do not own.
05 / Placement map
Your highest-leverage AI page may belong to someone else.
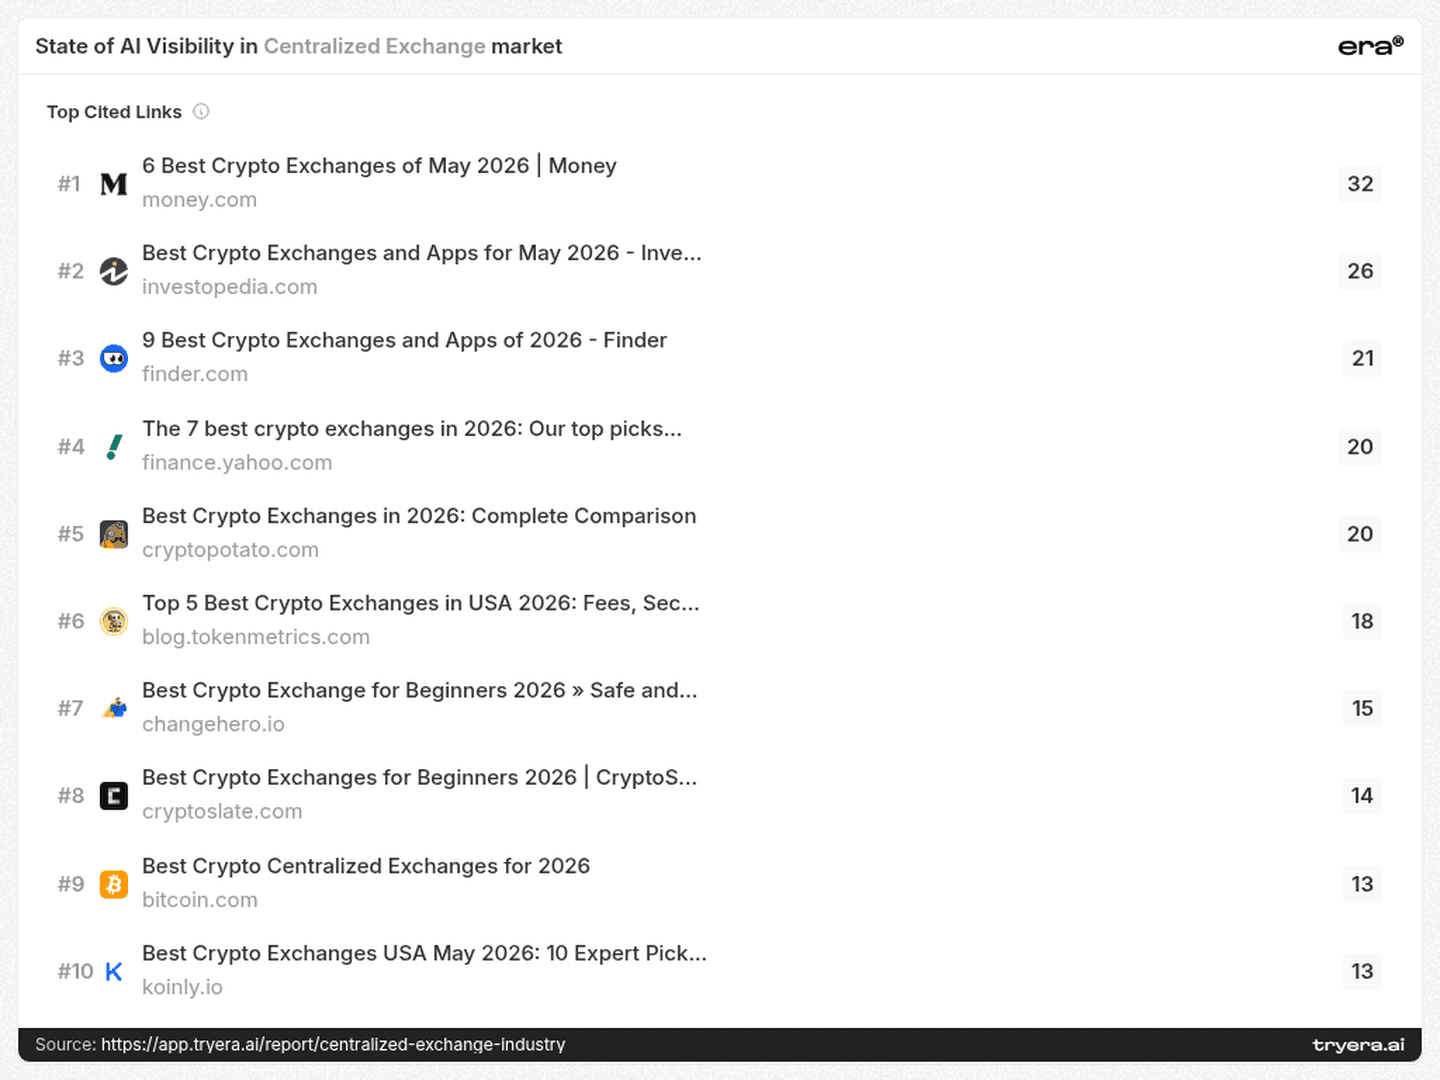
The five most-cited pages shown are third-party comparisons
Together these five pages account for 119 citation occurrences; those are not 119 unique prompts.
This turns a generic PR list into a placement map. First, check whether your brand is present and accurately described. Second, identify which user job each page serves. Third, build the owned page that should be cited when a model asks for proof — with clear comparisons, named entities, current facts, source links and structured data.
06 / Authority
Technical readiness and brand authority are different advantages.
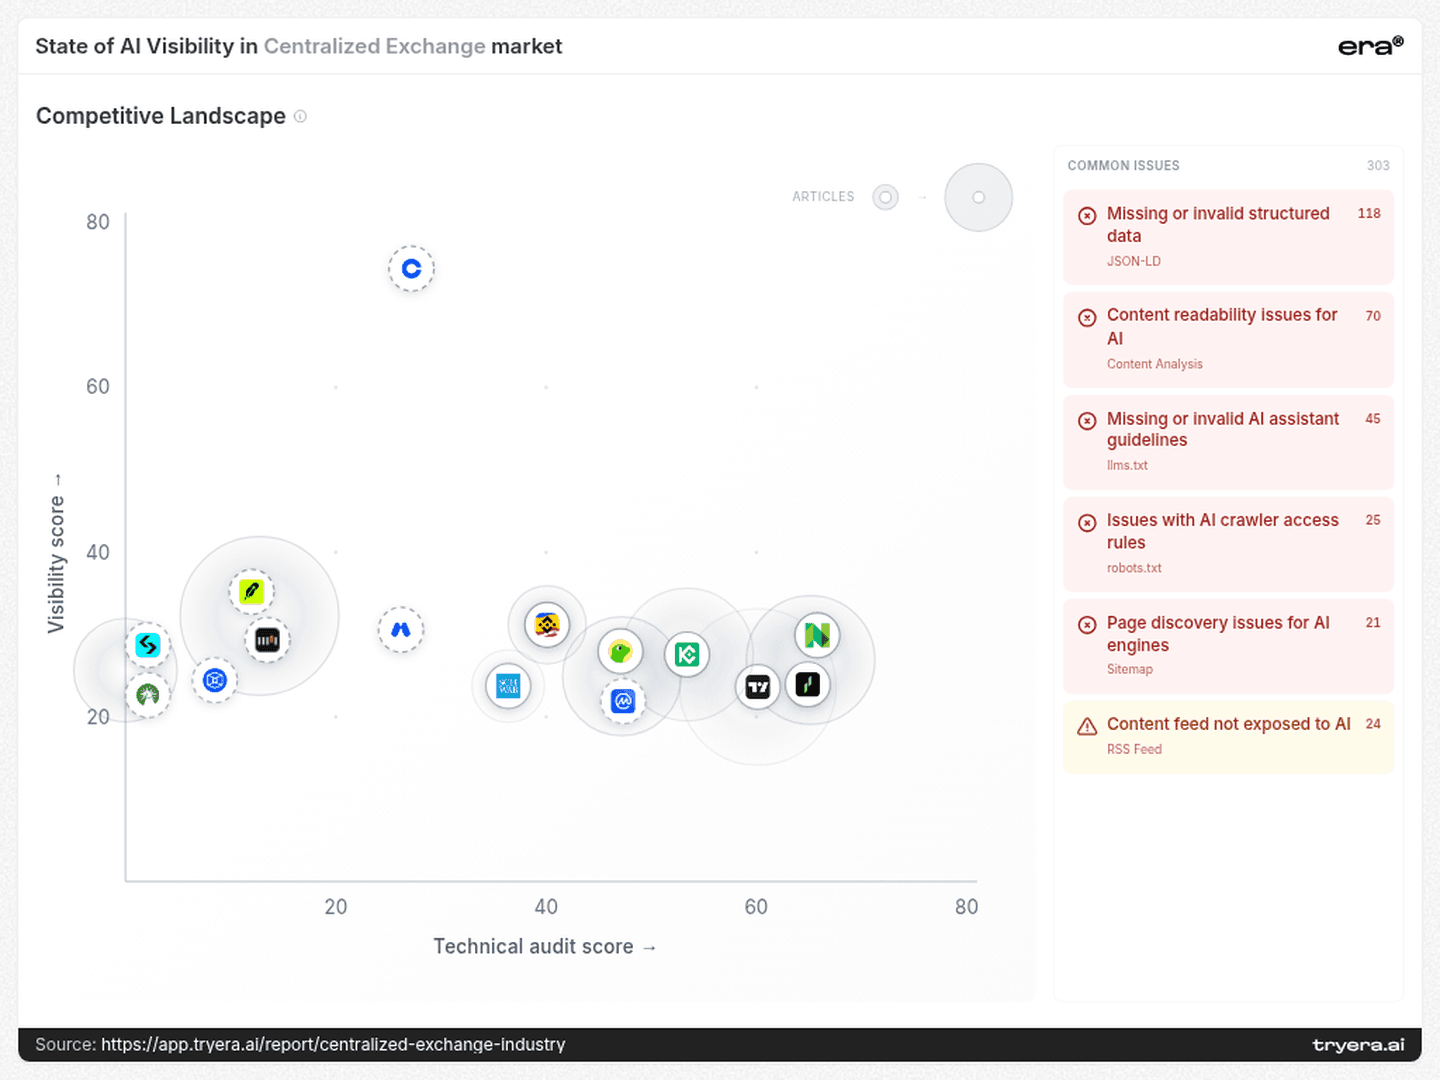
Readiness is not authority — and authority is not readiness
The quadrant is a diagnostic framework, not a causal ranking.
The audit found 303 issues across 30 players, including 118 structured- data issues, 70 readability problems, 45 llms.txt issues, 25 robots.txt issues, 21 sitemap issues and 24 RSS-feed issues. The competitive-landscape chart uses its own visibility-score scale: Coinbase sits near 74 visibility / 27 audit, Robinhood near 35 / 12, and Binance.US near 31 / 40. Those chart coordinates should not be mixed with the headline visibility percentage.
The bubble labels make the non-linearity clearer. Robinhood has 46.5k articles versus 10.6k for Binance.US — more than four times the article footprint — but leads it by only four points on the landscape visibility score. Binance.US has the stronger audit score, yet lower visibility. More pages and cleaner technical foundations help, but neither substitutes for the right prompts, sources and proof.
07 / Category boundaries
Your competitors are not only exchanges.
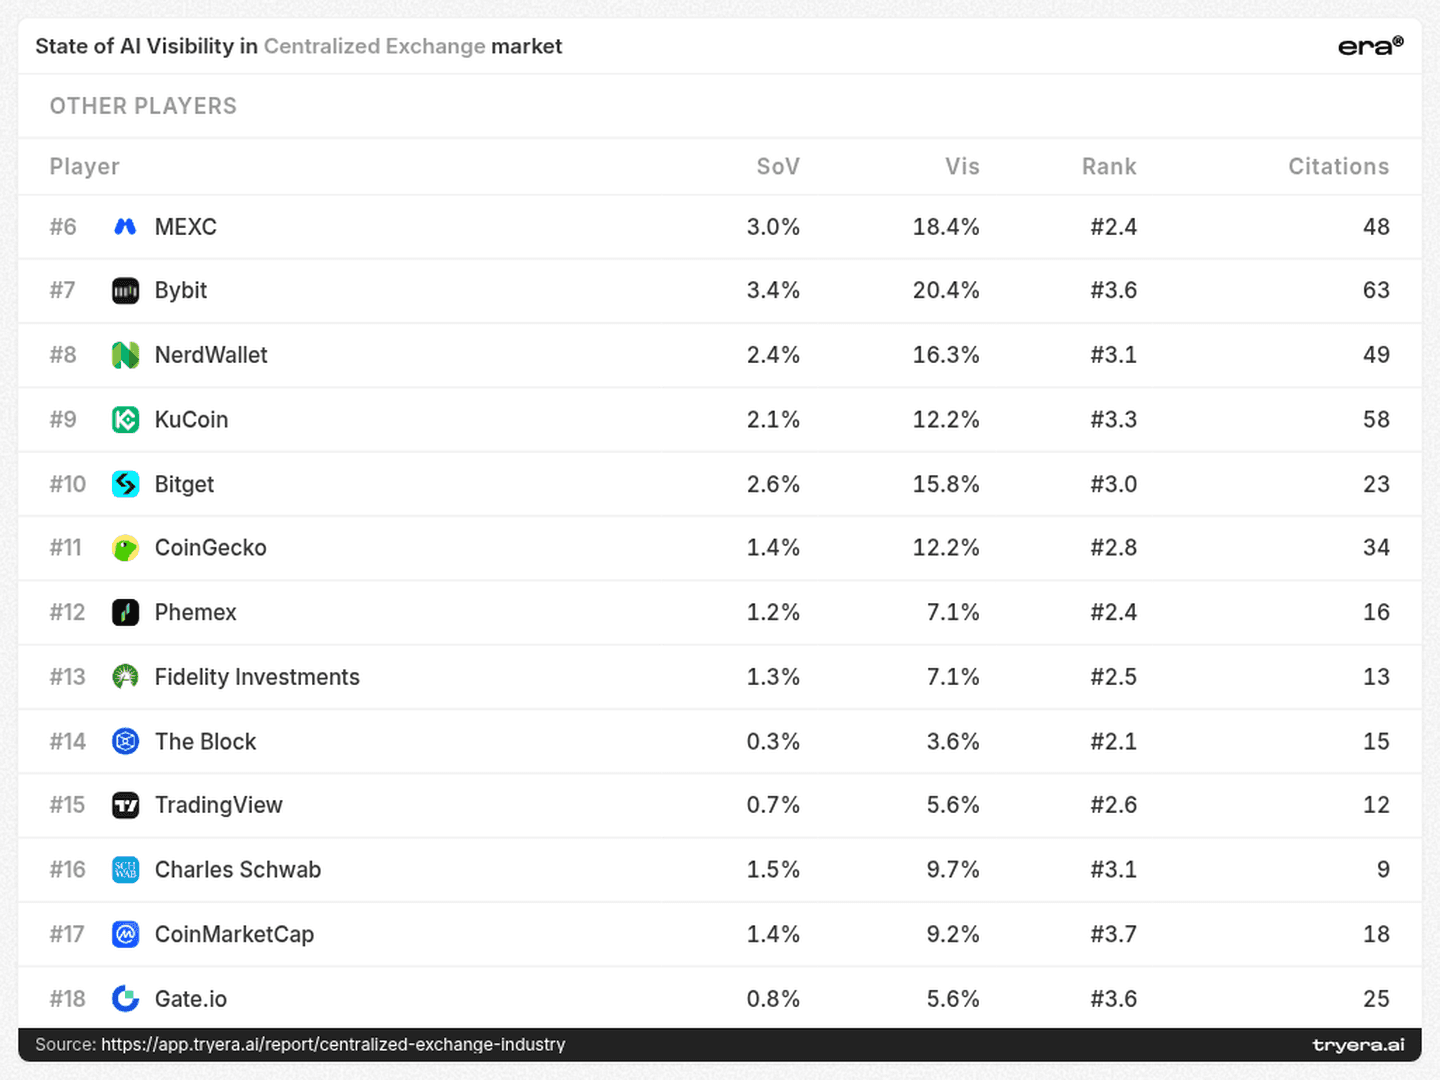
AI answers the user’s job, not your category definition
Publishers, analytics platforms and brokers enter the same answer space as exchanges.
NerdWallet ranks #8, CoinGecko #11 and Fidelity Investments #13 in the “other players” table. A publisher, an analytics platform and a broker are competing inside the same answer space as exchanges. Meanwhile, 49.5% of share of voice belongs to “Other”. These are not random intruders; the prompt set explicitly asks for brokers, trend research, review platforms and comparison services.
The report also lists OKX and OKEx as separate entities pointing to okx.com. Both show 23.0% visibility, rank #3.0 and 76 citations, while their share-of-voice values differ at 3.7% and 1.0%. Do not add them together blindly: the split is a data limitation and a warning that inconsistent entity naming can divide authority you already earned.
08 / Where could you enter?
A practical 90-day plan.
Cluster prompts by job. Give safety, cost, beginners, liquidity and support separate owners.
Measure each cluster by engine. Find the 0%-to-39% gaps hidden by the average.
Build a source map. List cited pages, current inclusion and the proof each page uses.
Create missing proof. Publish one retrievable page for one job, not generic brand copy.
Fix retrieval and entities. Structured data, crawler access and consistent naming are table stakes.
Rerun the same prompts. Track visibility, position and share of voice by intent.
Which intent, engine and source chain do you own — and which one can you take next?
Want this scoreboard for your own brand? Run a free audit at tryera.ai/free-report — 30 minutes, your numbers, no deck required.
Full report with source data: Centralized Exchange Industry.



A buyer does not ask ChatGPT for a category leaderboard. They ask for an outcome: the safest exchange, the lowest total cost, the easiest place to start, or the best venue for liquidity. We ran 50 of those questions through ChatGPT, Perplexity, Google AI and Claude, then traced which brands entered the answers and which pages the models used as evidence. The result is not one ranking. It is a chain: user intent → retrieved source → brand mention → position in the answer.
Visibility gets you named. Citability decides how much of the answer you own.
01 / Intent
People do not search for exchanges. They search for outcomes.
Buyer jobs shape the prompt set — and each player has a different winning query
The official Era search-query page shows the top query for each visible player. This is not search-volume data.
Twelve questions are about safety, trust, compliance or storage. Eleven are about beginners and product experience. Nine are about fees and total cost. Another nine ask for reports, reviews or market intelligence. Six focus on liquidity, access or trading use cases, and three on support. In other words, 64% of the prompt set is about risk, cost or ease of use — not token count and not a generic “best exchange” claim.
“safest centralized exchanges to buy bitcoin”
“best no hidden fee crypto exchange”
“best US crypto exchanges high liquidity 2026”
“best crypto exchanges for beginners in the US”
The raw prompt table makes the category boundary problem visible. The test set moves between exchanges, brokers, mobile trading apps, newsletters, research tools, review platforms and fee-comparison services. Models are not deciding which company fits a neat CEX taxonomy; they are deciding which entity can complete the buyer’s job.
Coinbase and Binance.US are strongest around high-liquidity US queries. Robinhood Crypto and NerdWallet surface around the “no hidden fee” job. OKX, OKEx, MEXC and Bybit collide on low-fee trading-platform prompts. Bitget and Phemex win variants of the safety query. You do not win AI search by ranking for “crypto exchange”. You win a portfolio of narrow jobs.
02 / Reach vs depth
Coinbase wins reach. Kraken wins depth.
Two crowns: visibility and share of voice
Visibility asks whether the brand appears. Share of voice measures how much of the category conversation it occupies.
Coinbase appears in 70.4% of answers, with 326 citationsagainst an industry average of 34. But Kraken owns 8.8% share of voice, ahead of Coinbase at 7.9%. One company wins breadth; the other wins depth.
This is not a winner-take-all leaderboard. Kraken, Coinbase, Binance, OKX and Bybit — the top five by share of voice — add up to only 29.9%. The long tail labelled “Other” is larger than all five combined at 49.5%. A challenger does not need to beat Coinbase everywhere; it needs to become the defensible answer to one high-intent question.
Only 15.7% of Coinbase’s citation footprint comes from player-owned domains, while 76.8% comes from other sources. Kraken has a different advantage: kraken.com is the most-cited domain in the report. The data does not prove one causal story, but it shows two defensible routes into AI answers: become the default brand that many sources validate, or become a source models repeatedly retrieve.
03 / Engine gaps
Four engines produce four different markets.
A blended visibility score can hide a provider failure
The same entity can be a leader on one engine and nearly absent on another.
0 → 39.1% — NerdWallet / ChatGPT → Google AI
6.5 → 32% — MEXC / Google AI → Claude
34 → 2% — Binance.US / ChatGPT → Claude
28 → 4.3% — Bybit / ChatGPT → Google AI
These are not rounding errors. They are different retrieval systems using different source graphs and ranking defaults. The useful unit of analysis is intent × model × source, not a single brand average. A Google AI gap points you toward the pages Google retrieves. A Claude gap requires a different source audit.
The winners are built in the citation layer.
04 / Sources
The evidence layer behind the leaderboard.
Top citation sources
Source shares shown in the public report; citation occurrences are distinct from the report’s count of unique sources.
kraken.com 90 / 18.9%
nerdwallet.com 69 / 14.5%
youtube.com 57 / 11.9%
reddit.com 42 / 8.8%
cryptoslate.com 42 / 8.8%
Kraken and NerdWallet occupy a rare position: they are players in the answer and sources behind the answer. A useful explainer can be retrieved across many prompts, repeatedly putting the same entity back into the evidence set. Yet even NerdWallet — the strongest owned-domain share shown at 24.1% — still gets 67% of its citations from third parties. Coinbase gets 76.8% from outside sources; Robinhood gets 78%. Their AI presence depends mainly on pages they do not own.
05 / Placement map
Your highest-leverage AI page may belong to someone else.
The five most-cited pages shown are third-party comparisons
Together these five pages account for 119 citation occurrences; those are not 119 unique prompts.
This turns a generic PR list into a placement map. First, check whether your brand is present and accurately described. Second, identify which user job each page serves. Third, build the owned page that should be cited when a model asks for proof — with clear comparisons, named entities, current facts, source links and structured data.
06 / Authority
Technical readiness and brand authority are different advantages.
Readiness is not authority — and authority is not readiness
The quadrant is a diagnostic framework, not a causal ranking.
The audit found 303 issues across 30 players, including 118 structured- data issues, 70 readability problems, 45 llms.txt issues, 25 robots.txt issues, 21 sitemap issues and 24 RSS-feed issues. The competitive-landscape chart uses its own visibility-score scale: Coinbase sits near 74 visibility / 27 audit, Robinhood near 35 / 12, and Binance.US near 31 / 40. Those chart coordinates should not be mixed with the headline visibility percentage.
The bubble labels make the non-linearity clearer. Robinhood has 46.5k articles versus 10.6k for Binance.US — more than four times the article footprint — but leads it by only four points on the landscape visibility score. Binance.US has the stronger audit score, yet lower visibility. More pages and cleaner technical foundations help, but neither substitutes for the right prompts, sources and proof.
07 / Category boundaries
Your competitors are not only exchanges.
AI answers the user’s job, not your category definition
Publishers, analytics platforms and brokers enter the same answer space as exchanges.
NerdWallet ranks #8, CoinGecko #11 and Fidelity Investments #13 in the “other players” table. A publisher, an analytics platform and a broker are competing inside the same answer space as exchanges. Meanwhile, 49.5% of share of voice belongs to “Other”. These are not random intruders; the prompt set explicitly asks for brokers, trend research, review platforms and comparison services.
The report also lists OKX and OKEx as separate entities pointing to okx.com. Both show 23.0% visibility, rank #3.0 and 76 citations, while their share-of-voice values differ at 3.7% and 1.0%. Do not add them together blindly: the split is a data limitation and a warning that inconsistent entity naming can divide authority you already earned.
08 / Where could you enter?
A practical 90-day plan.
Cluster prompts by job. Give safety, cost, beginners, liquidity and support separate owners.
Measure each cluster by engine. Find the 0%-to-39% gaps hidden by the average.
Build a source map. List cited pages, current inclusion and the proof each page uses.
Create missing proof. Publish one retrievable page for one job, not generic brand copy.
Fix retrieval and entities. Structured data, crawler access and consistent naming are table stakes.
Rerun the same prompts. Track visibility, position and share of voice by intent.
Which intent, engine and source chain do you own — and which one can you take next?
Want this scoreboard for your own brand? Run a free audit at tryera.ai/free-report — 30 minutes, your numbers, no deck required.
Full report with source data: Centralized Exchange Industry.