September 21, 2026
September 21, 2026
How Bali Real Estate Developers Rank in AI Search: Leaders, Blind Spots and Buyer Intent
Magnum Estate leads Era’s Bali developer podium, but the competitive picture changes across Share of Voice, AI engines and buyer questions. The report reveals concentrated provider exposure, narrow routes into consideration and a prominent role for comparison pages.
Magnum Estate leads Era’s Bali developer podium, but the competitive picture changes across Share of Voice, AI engines and buyer questions. The report reveals concentrated provider exposure, narrow routes into consideration and a prominent role for comparison pages.
For a Bali property developer, appearing in an AI answer can mean entering a buyer’s shortlist before the first enquiry. But a question about reliable villa construction creates a different competitive opening from a search for investment returns or buyer experiences. Era’s report on real estate developers in Bali examines brand visibility, placement, citations, search queries and technical signals. Together, these measures show where companies appear, which sources enter the answer and where a seemingly strong presence becomes uneven. The useful question is more specific than “Who ranks first?” It is which developers appear for which concerns, on which engines, and with what supporting evidence.
A developer can outperform a podium rival in ChatGPT and disappear entirely from two other engines.
Alpha Partner Bali illustrates the problem with treating AI search as one leaderboard. Its report-wide Visibility reaches 48% in ChatGPT, ahead of BREIG Property’s 40%, while registering 0% in Google AI and Claude. For a developer planning its next quarter, that unevenness is more actionable than an average alone.
1. The scoreboards — Magnum’s podium lead is only one view of competition
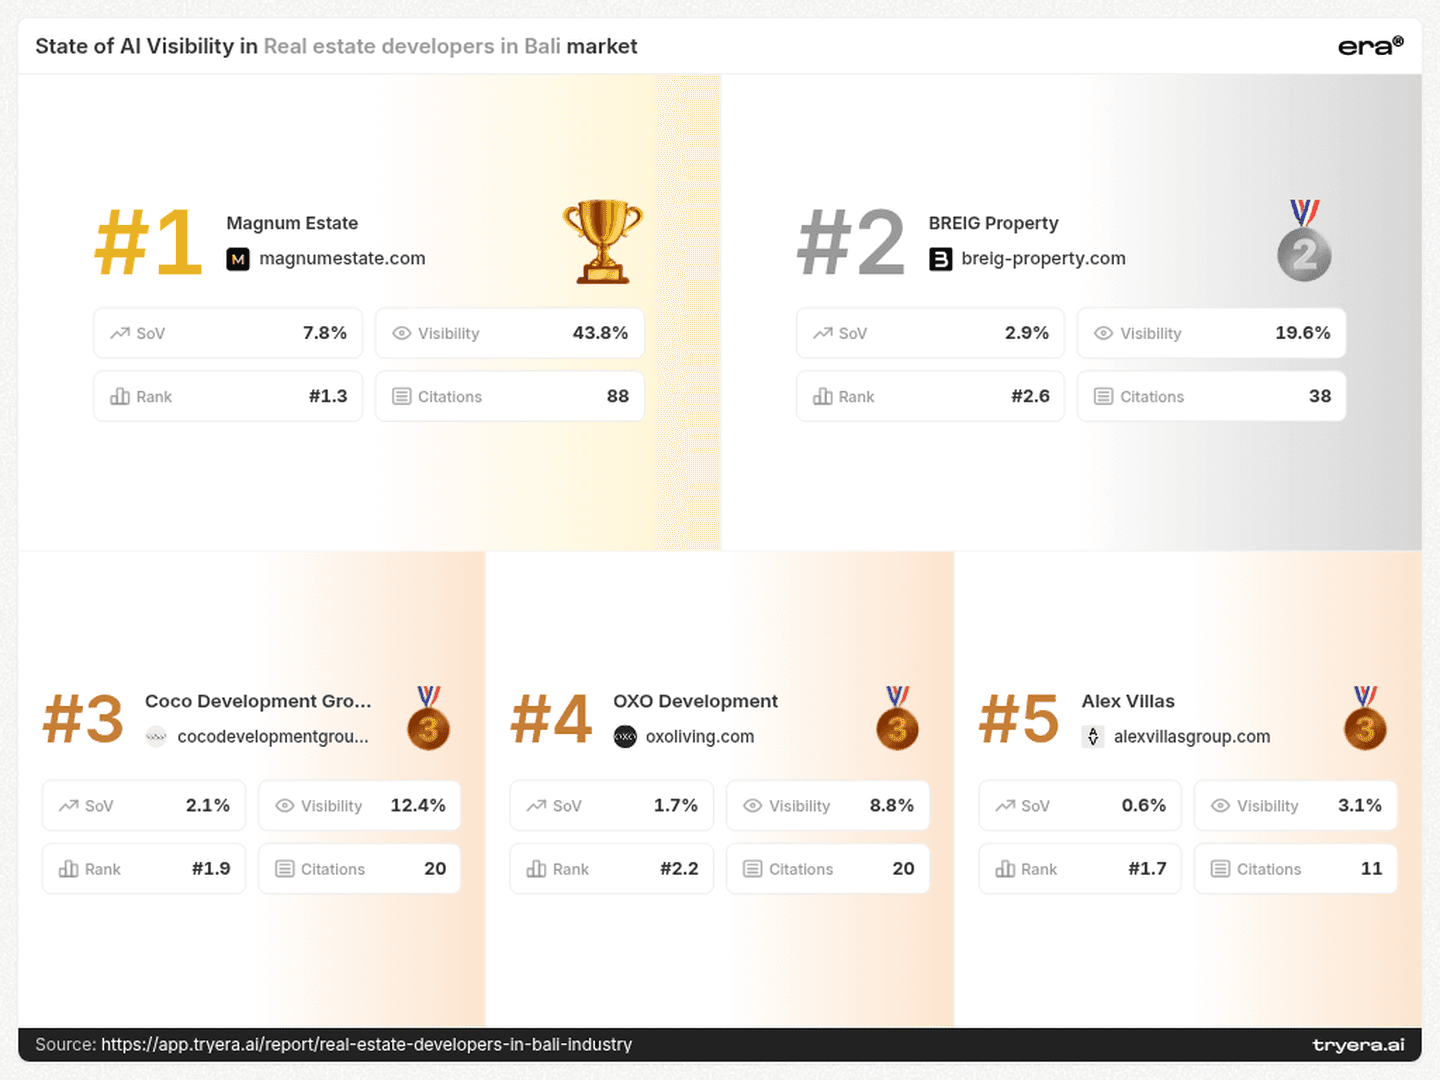
Magnum Estate occupies the report’s first podium position, with 43.8% Visibility, 7.8% Share of Voice and an average Rank of 1.3. BREIG Property follows on the podium with 19.6% Visibility, while Coco Development Group records 12.4%.
The Share of Voice chart introduces a different ordering: Balitecture has 21.7%, iLot Property Bali 12.0%, Mirah Investment & Development 11.1%, and Kingswood Bali 9.9%, all above Magnum’s 7.8%.
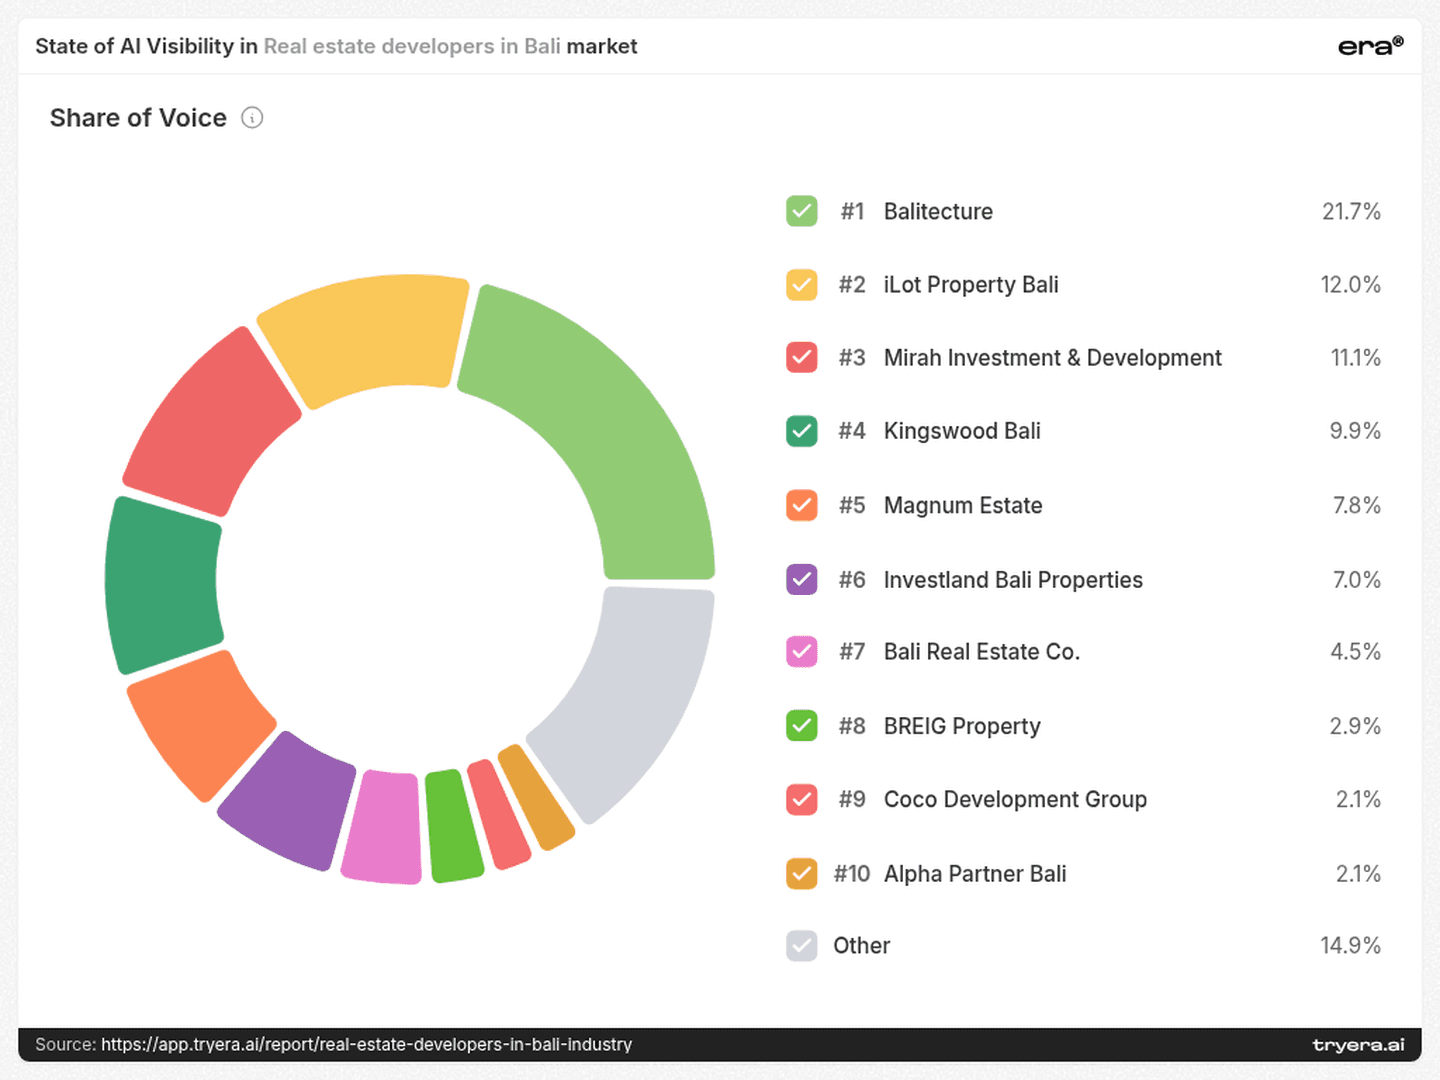
These measures answer different questions. Visibility measures how often a brand appears in monitored answers; Share of Voice measures its mentions relative to mentions of tracked brands. Podium placement is another reported ordering and should not be presented as the Share of Voice ranking.
A developer’s monitoring list should therefore extend beyond the podium. Balitecture, iLot and Kingswood belong in the competitive review even if the initial dashboard focuses attention elsewhere. The business task is to understand the competitive set for each question, rather than adopt one display as the definitive market hierarchy.
2. Provider gaps — the rival changes when the engine changes
Alpha Partner Bali’s profile is sharply concentrated: 48% ChatGPT, 2% Perplexity, 0% Google AI and 0% Claude. Royal Bali Group shows an even more concentrated pattern: 34% in ChatGPT and 0% in the other three displayed engines.
Coco Development Group points in another direction. It records 26% Visibility in Claude, compared with BREIG Property’s 8%, but 0% in ChatGPT. OXO Development is strongest in Perplexity at 24%, against 10% in ChatGPT and 0% in Google AI and Claude.
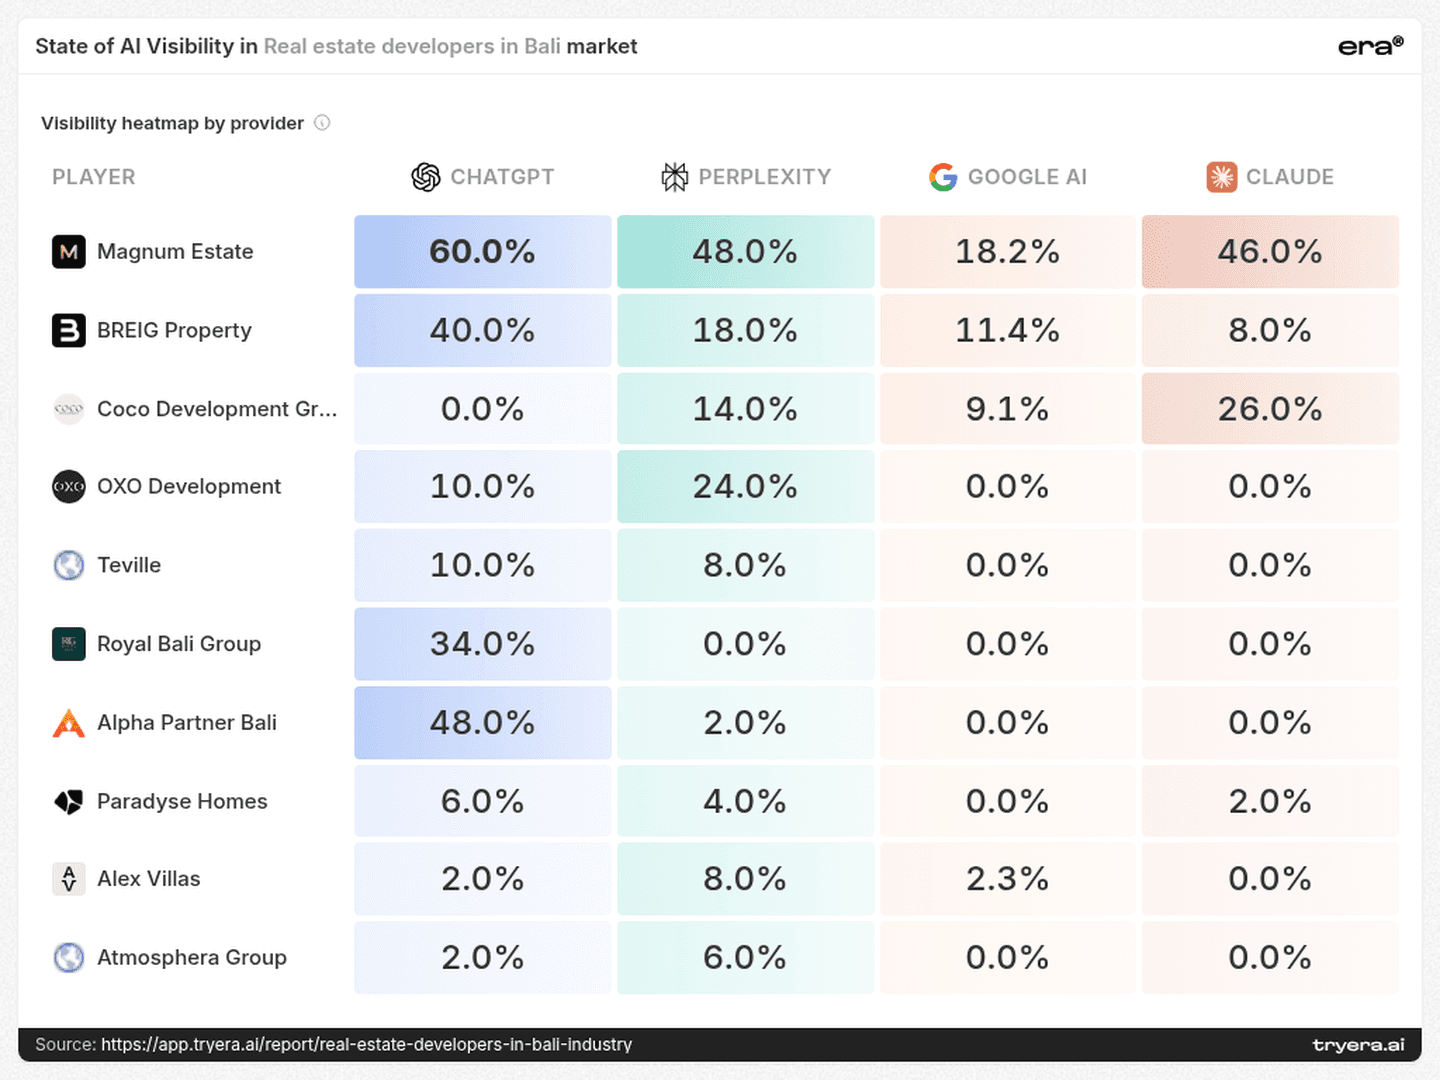
This changes how teams should investigate competitors. Alpha’s ChatGPT presence is a useful place to examine successful appearances; Coco’s Claude presence offers a different comparison set. Neither pattern establishes why an engine includes or omits a company.
The next test should hold the buyer question constant across engines and record the brands, positions and sources returned. These percentages describe each provider across the report; they are not results for a single query.
A strong presence on one engine can conceal an almost empty presence on another.
3. Buyer intent — reliability, budget and reputation create distinct openings
The top-query page moves the analysis beyond generic “best developer” searches. It associates Teville with “Bali villa builders foreign owners reliable” and Atmosphera Group with “Bali turnkey villa package 300k USD”.
Paradyse Homes appears alongside “best Bali real estate developers investment ROI 2026”, while Alex Villas is associated with “Bali property developers reviews buyer experiences complaints”.
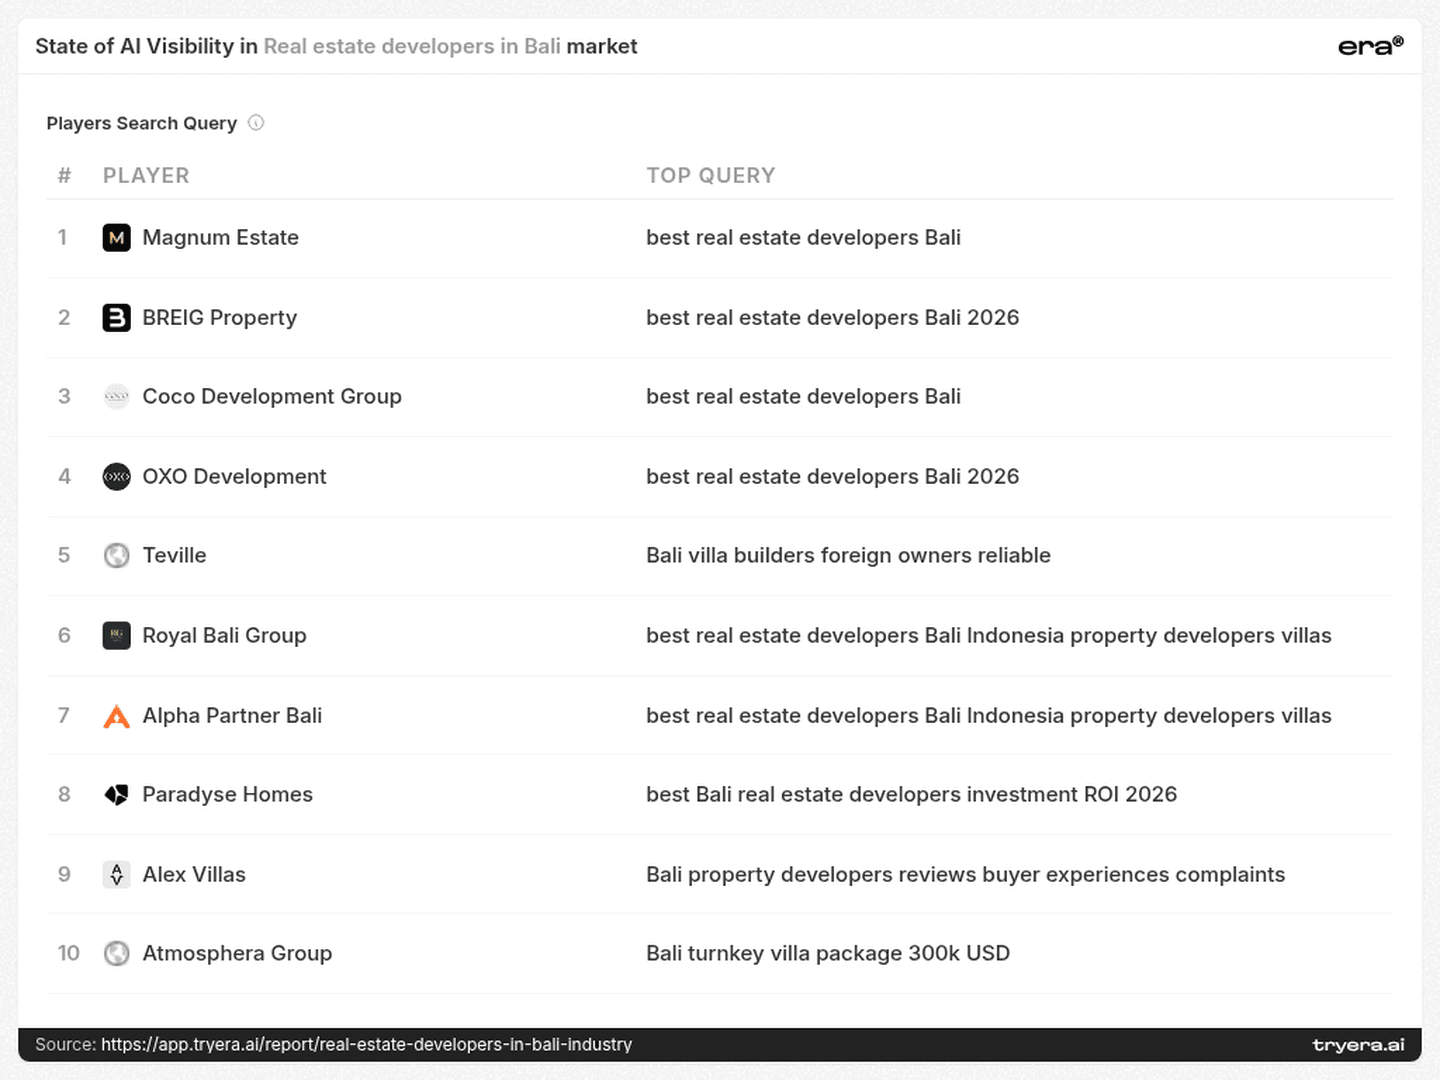
These are distinct buyer concerns, each suggesting a different content and evidence task:
Reliability: document completed work, supervision, handover procedures and how overseas owners receive progress updates.
Budget: make package scope, inclusions, exclusions and the date of a price statement easy to establish.
Investment assumptions: distinguish projections from observed results and explain the assumptions behind a model.
Buyer experience: make reviews, support processes and documented responses to concerns discoverable.
The query language identifies topics to investigate. It does not establish that Atmosphera sells a package at that price, that Paradyse delivers a particular return, or that complaints about Alex Villas are substantiated.
Teville and Atmosphera are useful examples of how a company outside the podium can enter the analysis through a specific buyer need. A relevant test set should preserve these distinctions instead of collapsing every question into “best real estate developers Bali.”
4. Reach and position — an early mention can still be a rare mention
Atmosphera Group records 2.1% Visibility and an average Rank of 1.0. Bali Nomad Development combines 3.1% Visibility with Rank 1.3. Alpha Partner Bali has broader reach at 12.9% Visibility, but a later average Rank of 2.9.
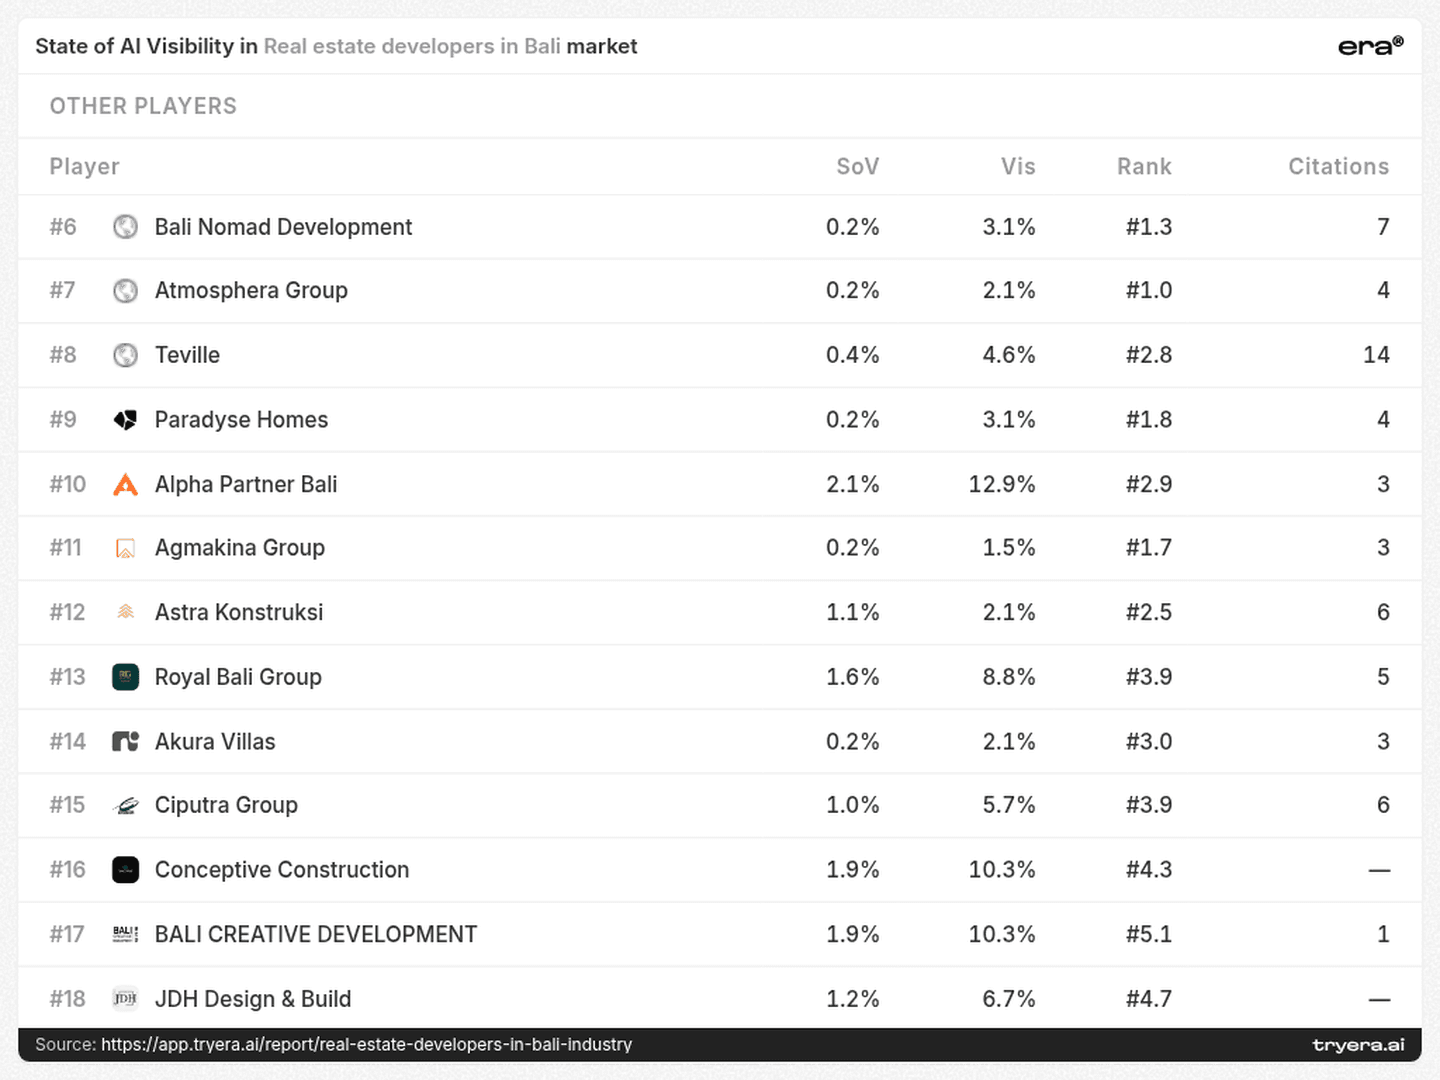
This distinction changes the diagnostic question. Atmosphera’s observed profile suggests examining where its relatively rare, early appearances occur and whether closely related buyer questions also include it. Alpha’s profile invites a separate review of how prominently it is placed when it appears.
Neither average proves that a company owns a niche. But the combination of reach and position helps a team decide which answers to inspect first. Low Visibility should not erase a company from competitive analysis, and a strong average position should not be confused with broad coverage.
5. Citation surfaces — comparison pages deserve a place in the competitive review
The cited-links page is led by the LinkedIn title “Top 10 Real Estate Developers in Bali 2026”, with a displayed count of 56. A Bali.realestate developer directory entry has 38, and a Differ.blog top-five comparison entry has 33.
The same list includes “The best real estate developers in Bali in 2024” on Bali.realestate, with 27. An older year in a title has not prevented that page from appearing in the report’s cited set.
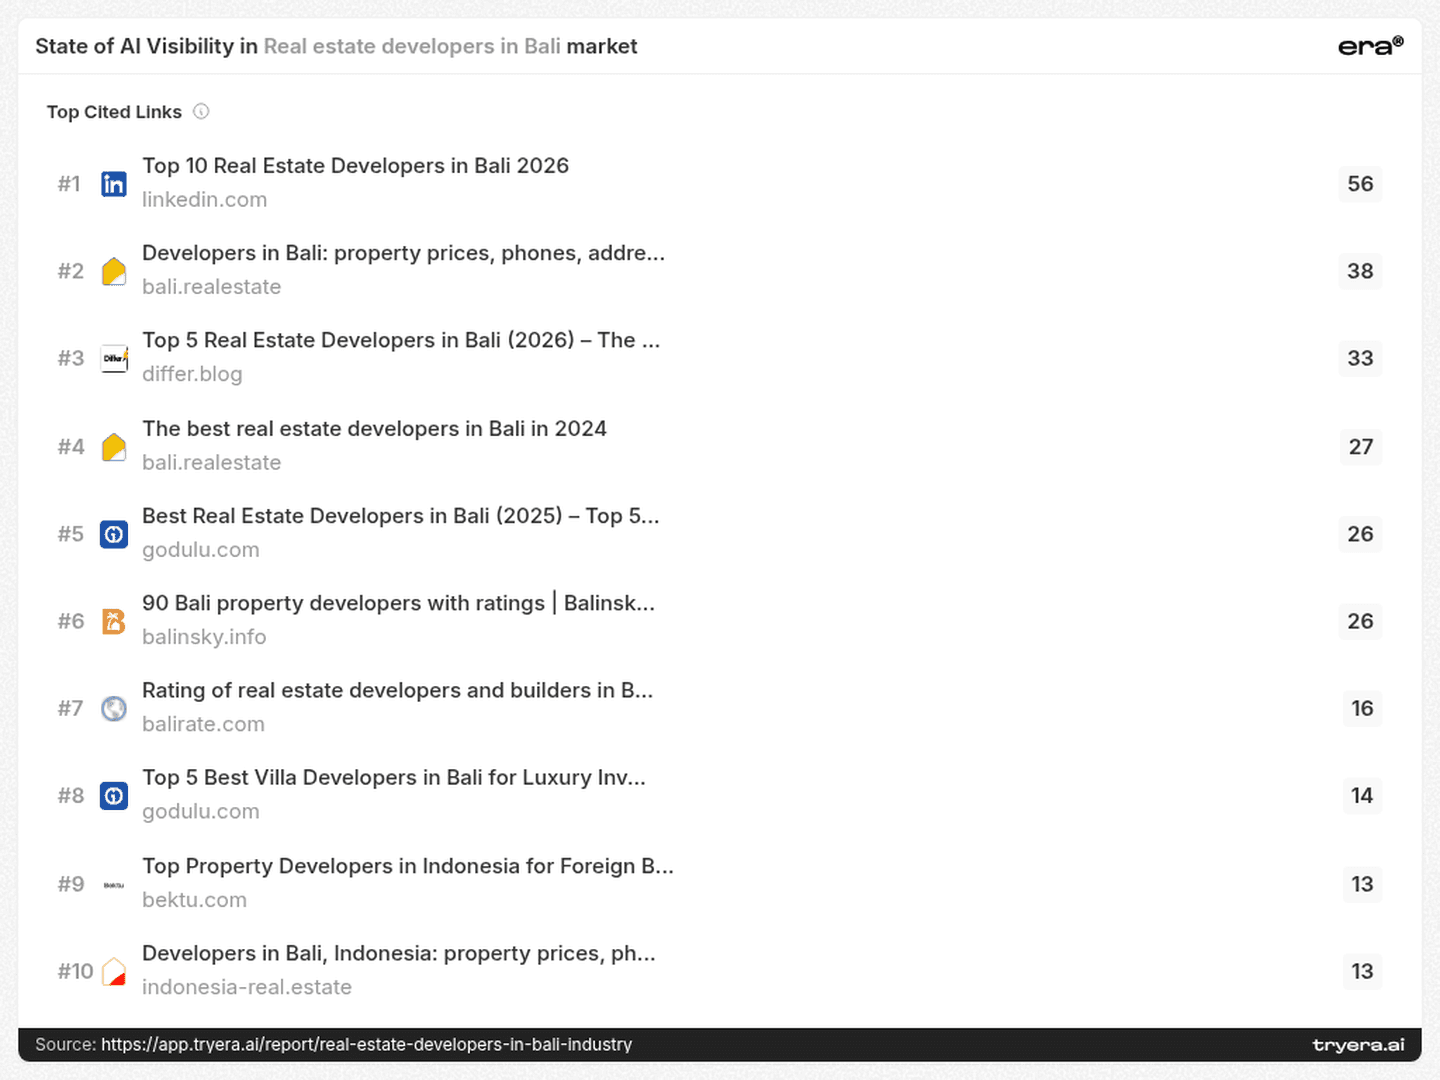
This is a concrete reason to inspect comparison and directory coverage. Check whether the company is included, whether descriptions are accurate, which projects are named and whether the evidence is current. Publishing a new annual list is not a substitute for understanding the pages already being cited.
The domain view adds another layer. It lists balitecture.com with 149, kingswoodbalivillas.com with 105, and magnumestate.com with 78 in their displayed citation counts.
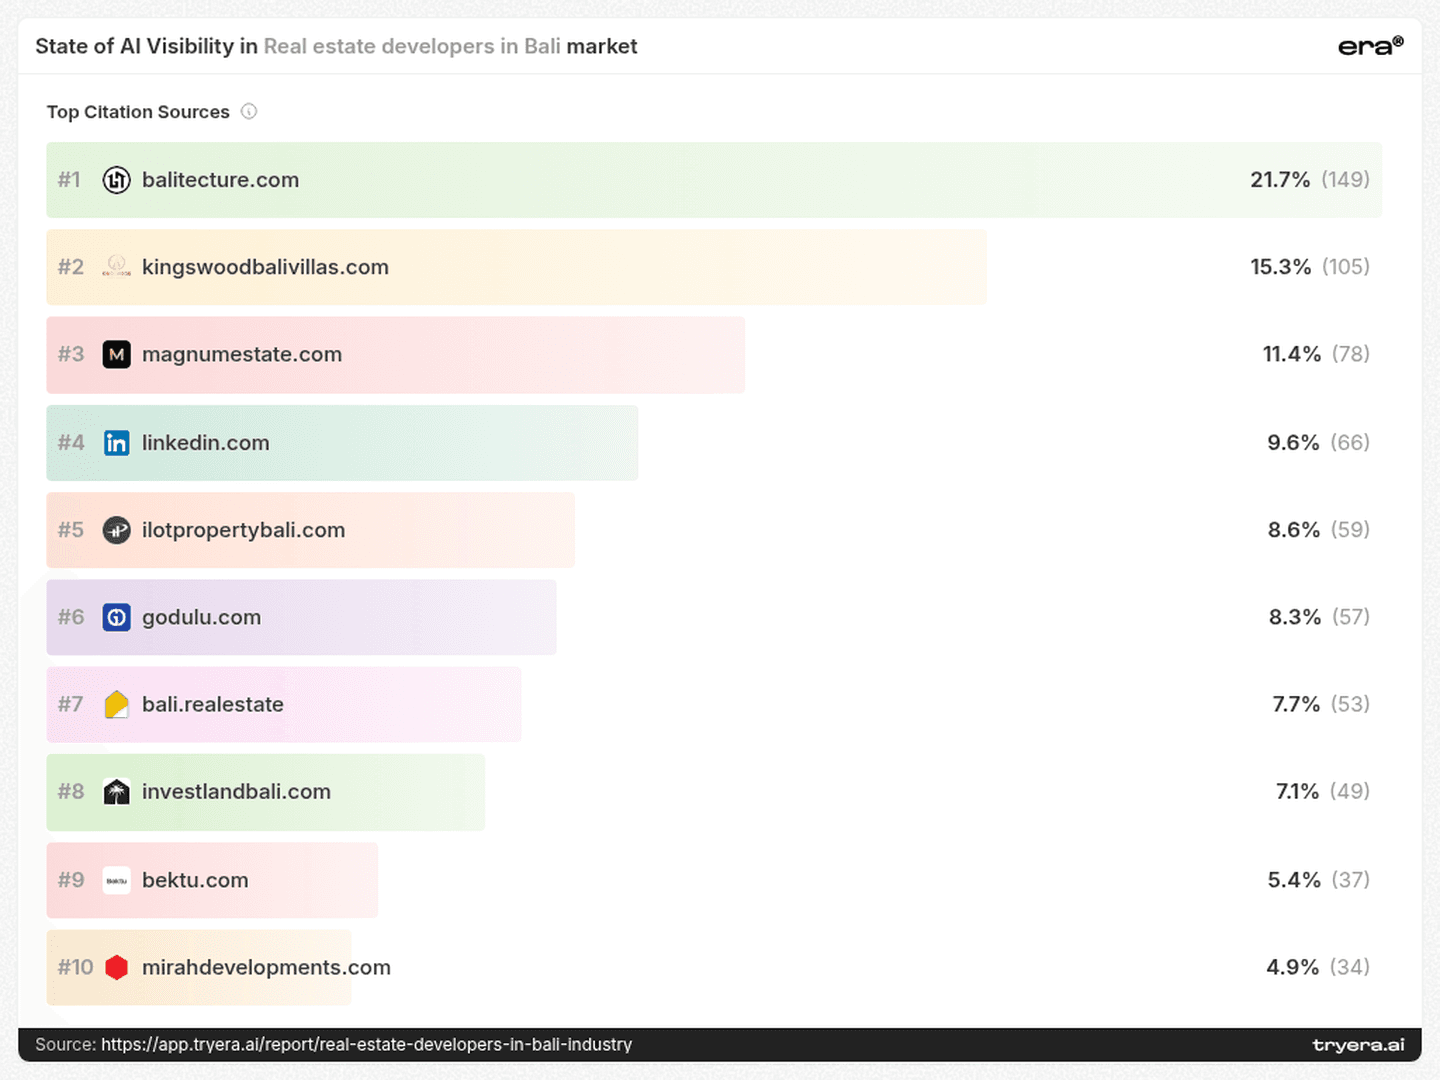
Competitor sites participate as information sources as well as brands. A citation review should therefore establish who owns and authored each influential page. A directory, a publisher and a competitor’s own comparison article require different scrutiny; appearing under another domain does not automatically make evidence independent.
The pages describing the market deserve attention alongside the companies competing in it.
6. Citation mix — more owned content is only part of the task
Teville’s citation mix contains 24.3% own-domain sources, compared with 6.3% for Royal Bali Group. Yet the report’s “Others” category remains the majority for both: 73.8% and 92.8%, respectively.
Alex Villas has a different balance: 22.5% social sources and 1.3% own-domain sources. Coco Development Group records 14.4% social and 11.0% own-domain.
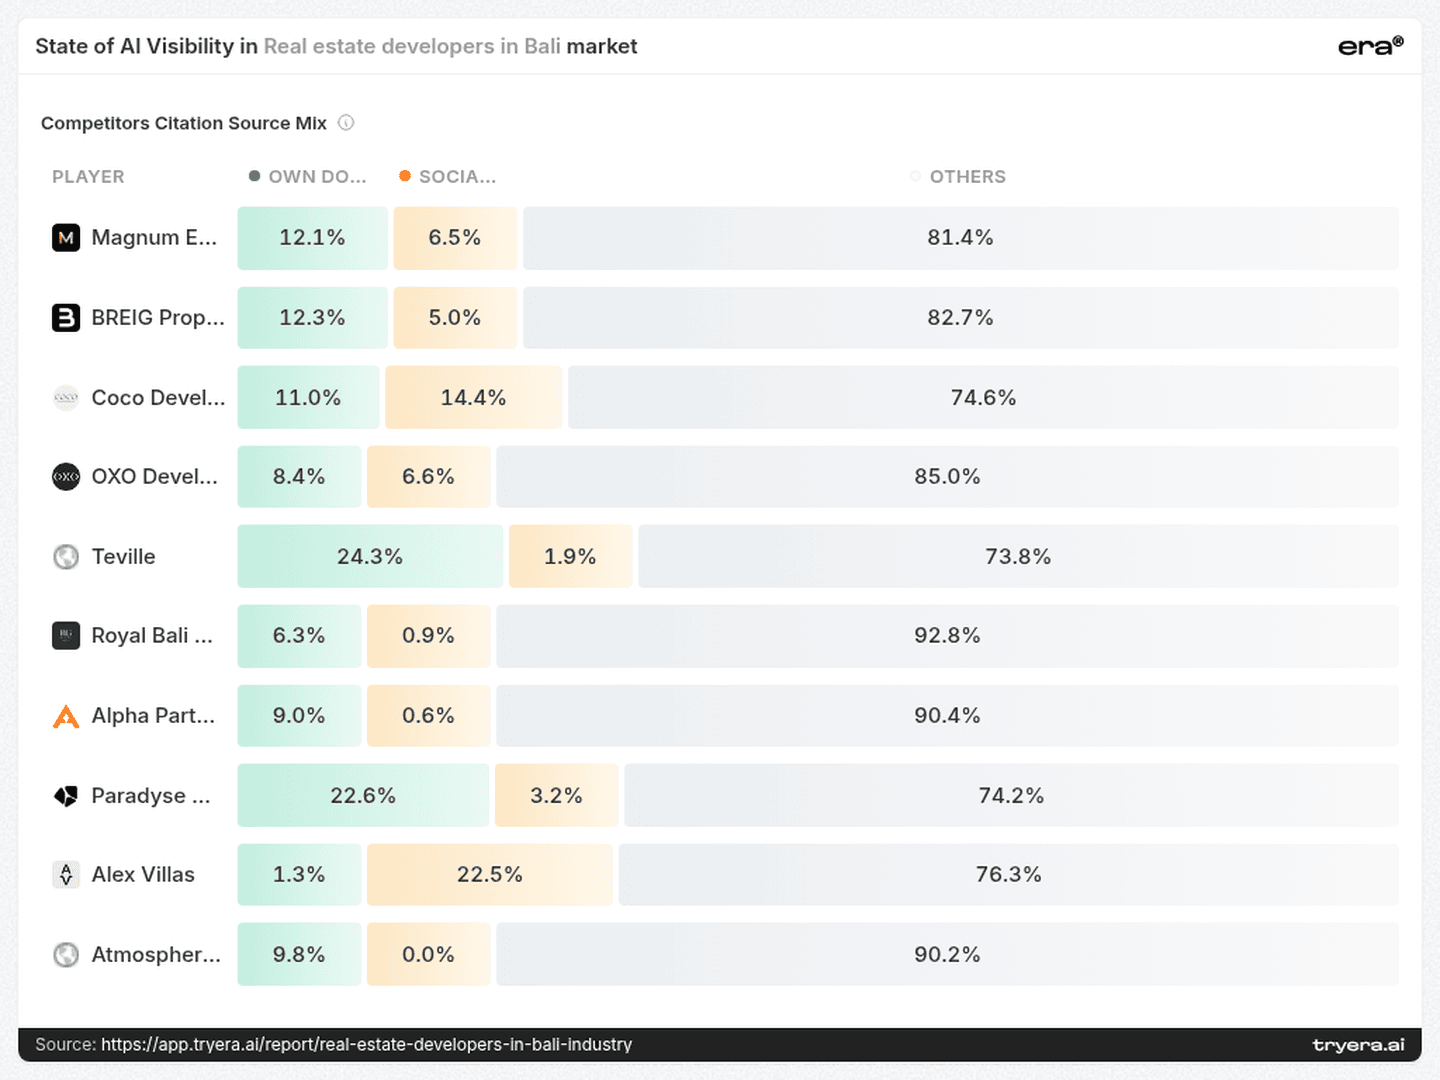
These proportions suggest different audit priorities. Teville should inspect which owned pages are useful enough to enter cited answers and whether adjacent buyer questions have comparable evidence. Royal Bali Group should examine the accuracy and provenance of the other sources describing it. Alex Villas should review whether important information found on social platforms is also available in a stable, current form on its own site.
A larger owned share is not automatically a better result. The goal is accurate, relevant evidence across the sources a buyer’s answer uses. “Others” is a source category, not a certification of editorial independence.
7. Technical signals — fix obstacles without treating them as a ranking formula
The technical panel reports 192 common issues, including 78 missing or invalid structured-data issues, 40 content-readability issues, and 19 AI crawler access-rule issues. It also lists 31 AI-assistant-guideline issues, 10 page-discovery issues and 14 content-feed issues.
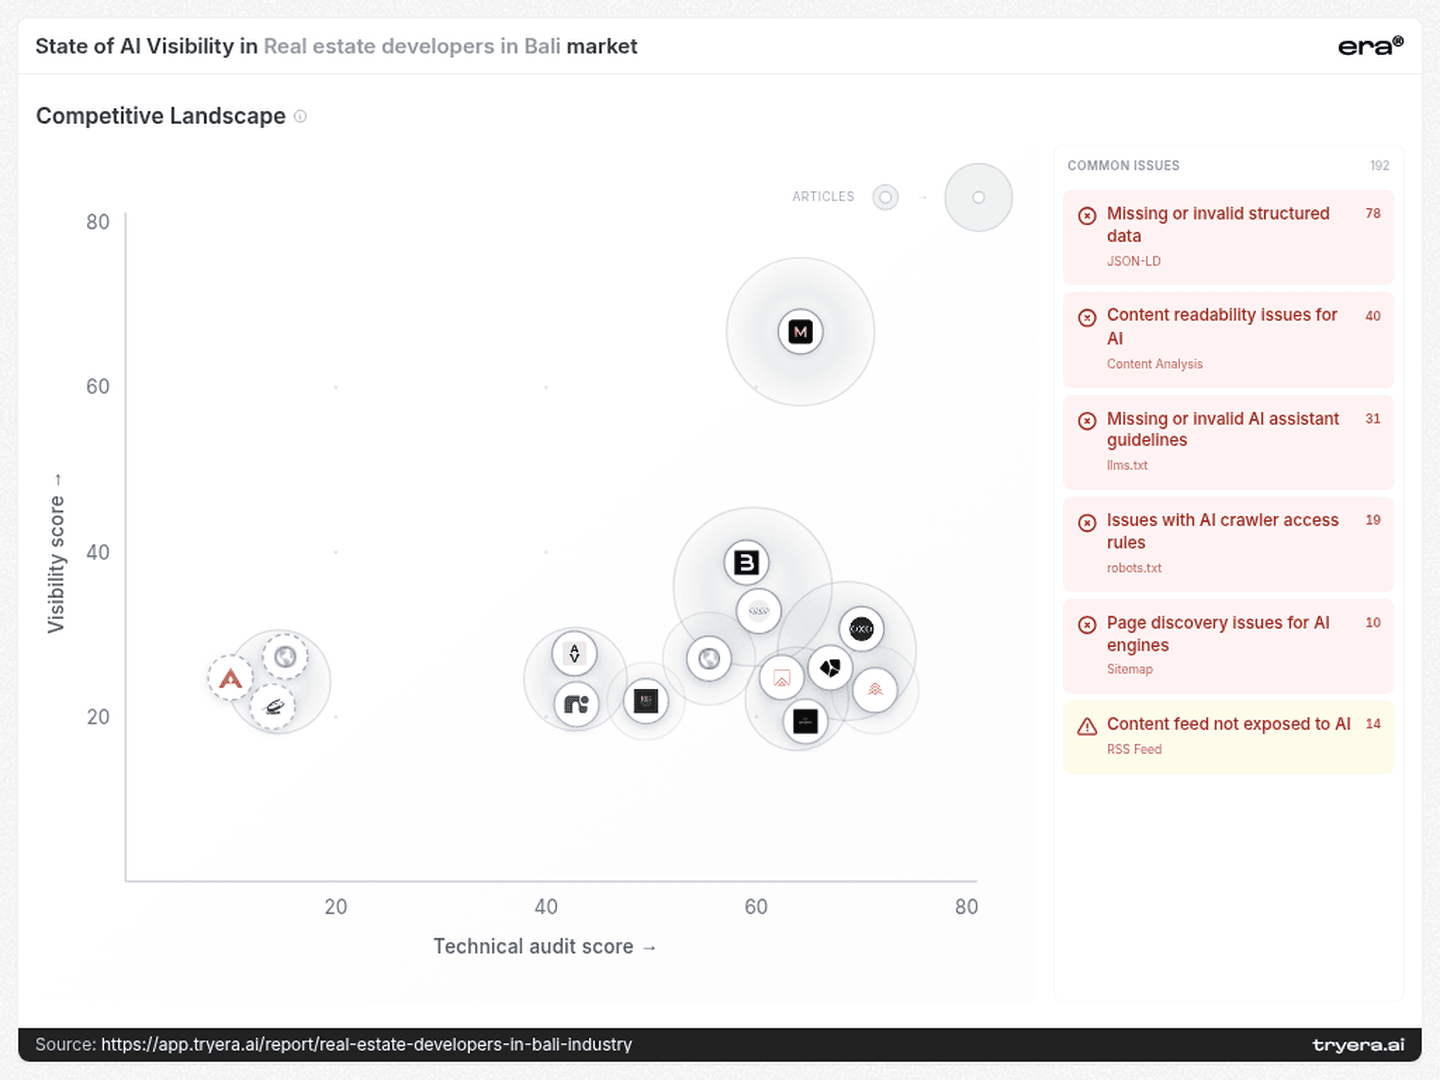
That is a remediation queue to investigate. Start with whether intended public pages can be accessed and whether their core facts are available as readable text. Check structured data against the visible content, then verify the relevant discovery paths. Treat each audit flag as something to diagnose, rather than a promise of improved AI placement.
Backlinks provide another useful distinction. Balitecture has 16.5K backlinks and 201 refs, while Ciputra Group has 5.5K backlinks and 654 refs. A greater total link count and a broader referring-source footprint are different properties.
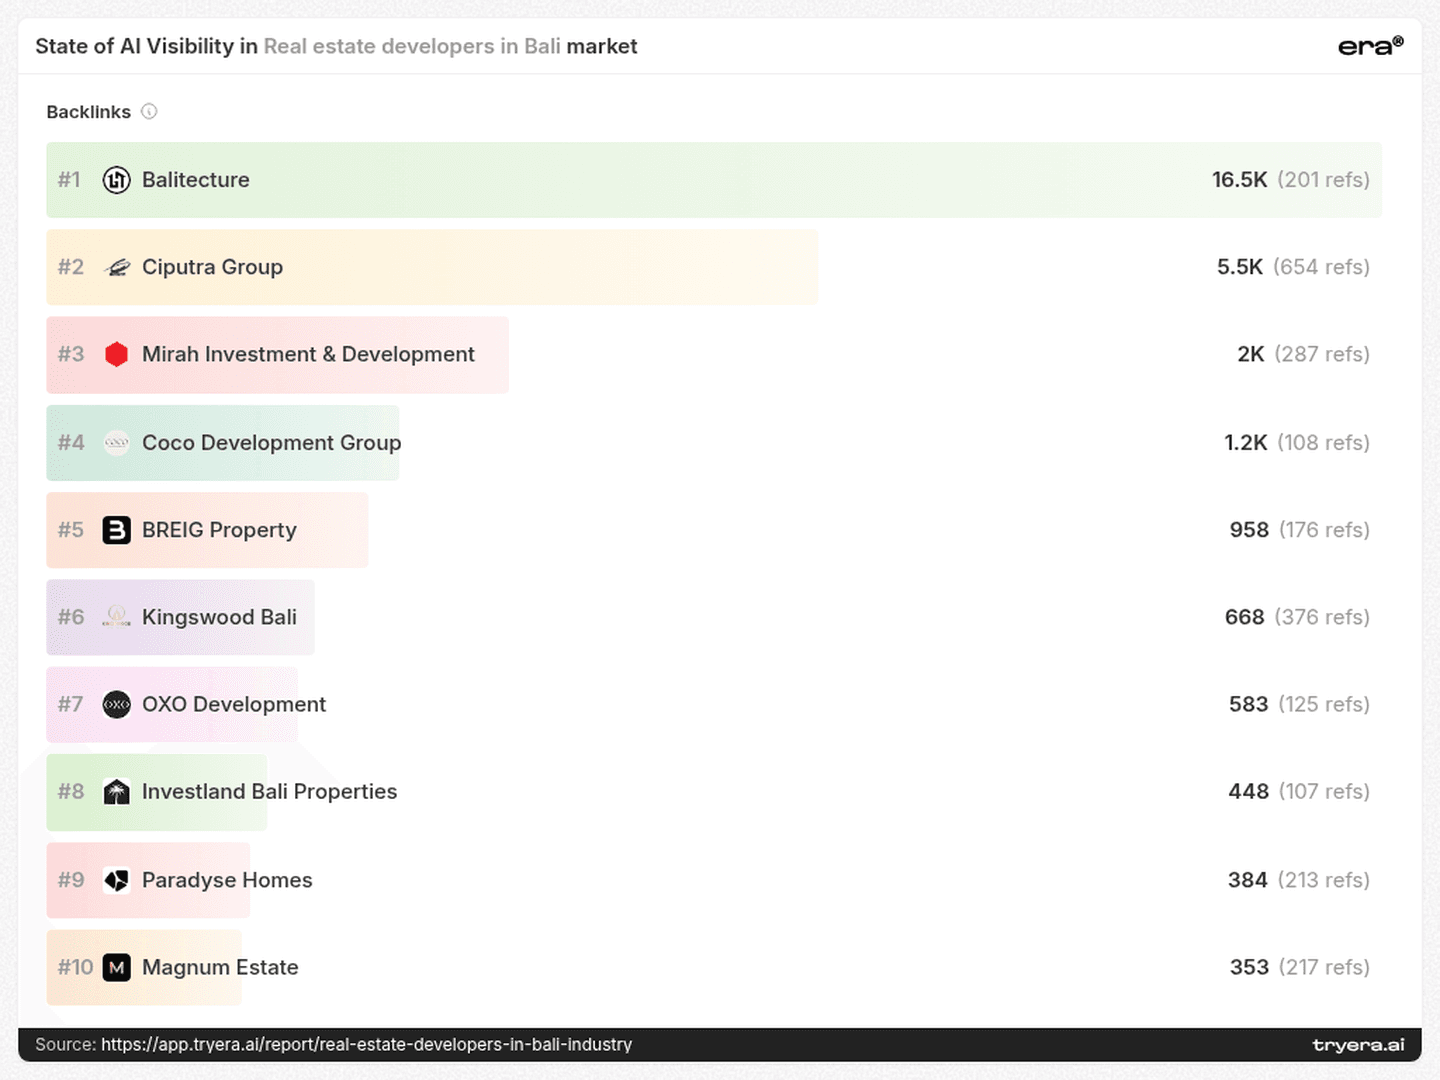
Nor does link volume reproduce the Visibility ordering. Ciputra records 5.7% Visibility in the other-players table, while Magnum records 43.8% on the podium despite a displayed backlink count of 353. The earlier podium and other-players images provide those separate Visibility figures.
For a developer, the practical review should focus on relevant referring pages, factual descriptions and accessible project evidence. Raw link totals alone do not explain the observed AI results.
8. The next 90 days — turn the gaps into a testable programme
Days 1–30: establish the buyer-question baseline.
Build separate test groups for developer comparisons, reliable construction for foreign owners, turnkey budgets, investment assumptions and buyer experiences. Run a consistent set across ChatGPT, Perplexity, Google AI and Claude. Record presence, position and exact citations separately. Include Alpha Partner Bali, Teville, Atmosphera and Royal Bali Group where relevant, alongside the podium and Share of Voice leaders.
The deliverable is a question-by-engine evidence log, with brand names and domains checked for duplicate entities before any totals are combined.
Days 31–60: repair the evidence for two priority intents.
Choose two buyer concerns that match the company’s actual offering. Publish or improve the supporting material: for example, a documented handover case for reliability and a dated package-scope page for budget questions. Check access, readable content and relevant structured data on those pages.
In parallel, review the comparison and directory pages already cited. Document inaccurate descriptions and request factual corrections where appropriate. Record page ownership and authorship before treating any source as independent confirmation.
Days 61–90: repeat the same tests and inspect what changed.
Rerun the original questions across the same engines. Check whether missing-provider appearances changed, whether rare mentions became more frequent and whether positions or cited sources shifted. Keep changes in Visibility, Share of Voice and source mix separate.
The result should be a documented comparison of answers and evidence, with clear priorities for the next cycle. It should not depend on assuming that one technical fix or one new article caused every movement.
Want this scoreboard for your own brand? Run a free audit at tryera.ai/free-report — 30 minutes, your numbers, no deck required.
Full report with source data: Real estate developers in Bali.



For a Bali property developer, appearing in an AI answer can mean entering a buyer’s shortlist before the first enquiry. But a question about reliable villa construction creates a different competitive opening from a search for investment returns or buyer experiences. Era’s report on real estate developers in Bali examines brand visibility, placement, citations, search queries and technical signals. Together, these measures show where companies appear, which sources enter the answer and where a seemingly strong presence becomes uneven. The useful question is more specific than “Who ranks first?” It is which developers appear for which concerns, on which engines, and with what supporting evidence.
A developer can outperform a podium rival in ChatGPT and disappear entirely from two other engines.
Alpha Partner Bali illustrates the problem with treating AI search as one leaderboard. Its report-wide Visibility reaches 48% in ChatGPT, ahead of BREIG Property’s 40%, while registering 0% in Google AI and Claude. For a developer planning its next quarter, that unevenness is more actionable than an average alone.
1. The scoreboards — Magnum’s podium lead is only one view of competition
Magnum Estate occupies the report’s first podium position, with 43.8% Visibility, 7.8% Share of Voice and an average Rank of 1.3. BREIG Property follows on the podium with 19.6% Visibility, while Coco Development Group records 12.4%.
The Share of Voice chart introduces a different ordering: Balitecture has 21.7%, iLot Property Bali 12.0%, Mirah Investment & Development 11.1%, and Kingswood Bali 9.9%, all above Magnum’s 7.8%.
These measures answer different questions. Visibility measures how often a brand appears in monitored answers; Share of Voice measures its mentions relative to mentions of tracked brands. Podium placement is another reported ordering and should not be presented as the Share of Voice ranking.
A developer’s monitoring list should therefore extend beyond the podium. Balitecture, iLot and Kingswood belong in the competitive review even if the initial dashboard focuses attention elsewhere. The business task is to understand the competitive set for each question, rather than adopt one display as the definitive market hierarchy.
2. Provider gaps — the rival changes when the engine changes
Alpha Partner Bali’s profile is sharply concentrated: 48% ChatGPT, 2% Perplexity, 0% Google AI and 0% Claude. Royal Bali Group shows an even more concentrated pattern: 34% in ChatGPT and 0% in the other three displayed engines.
Coco Development Group points in another direction. It records 26% Visibility in Claude, compared with BREIG Property’s 8%, but 0% in ChatGPT. OXO Development is strongest in Perplexity at 24%, against 10% in ChatGPT and 0% in Google AI and Claude.
This changes how teams should investigate competitors. Alpha’s ChatGPT presence is a useful place to examine successful appearances; Coco’s Claude presence offers a different comparison set. Neither pattern establishes why an engine includes or omits a company.
The next test should hold the buyer question constant across engines and record the brands, positions and sources returned. These percentages describe each provider across the report; they are not results for a single query.
A strong presence on one engine can conceal an almost empty presence on another.
3. Buyer intent — reliability, budget and reputation create distinct openings
The top-query page moves the analysis beyond generic “best developer” searches. It associates Teville with “Bali villa builders foreign owners reliable” and Atmosphera Group with “Bali turnkey villa package 300k USD”.
Paradyse Homes appears alongside “best Bali real estate developers investment ROI 2026”, while Alex Villas is associated with “Bali property developers reviews buyer experiences complaints”.
These are distinct buyer concerns, each suggesting a different content and evidence task:
Reliability: document completed work, supervision, handover procedures and how overseas owners receive progress updates.
Budget: make package scope, inclusions, exclusions and the date of a price statement easy to establish.
Investment assumptions: distinguish projections from observed results and explain the assumptions behind a model.
Buyer experience: make reviews, support processes and documented responses to concerns discoverable.
The query language identifies topics to investigate. It does not establish that Atmosphera sells a package at that price, that Paradyse delivers a particular return, or that complaints about Alex Villas are substantiated.
Teville and Atmosphera are useful examples of how a company outside the podium can enter the analysis through a specific buyer need. A relevant test set should preserve these distinctions instead of collapsing every question into “best real estate developers Bali.”
4. Reach and position — an early mention can still be a rare mention
Atmosphera Group records 2.1% Visibility and an average Rank of 1.0. Bali Nomad Development combines 3.1% Visibility with Rank 1.3. Alpha Partner Bali has broader reach at 12.9% Visibility, but a later average Rank of 2.9.
This distinction changes the diagnostic question. Atmosphera’s observed profile suggests examining where its relatively rare, early appearances occur and whether closely related buyer questions also include it. Alpha’s profile invites a separate review of how prominently it is placed when it appears.
Neither average proves that a company owns a niche. But the combination of reach and position helps a team decide which answers to inspect first. Low Visibility should not erase a company from competitive analysis, and a strong average position should not be confused with broad coverage.
5. Citation surfaces — comparison pages deserve a place in the competitive review
The cited-links page is led by the LinkedIn title “Top 10 Real Estate Developers in Bali 2026”, with a displayed count of 56. A Bali.realestate developer directory entry has 38, and a Differ.blog top-five comparison entry has 33.
The same list includes “The best real estate developers in Bali in 2024” on Bali.realestate, with 27. An older year in a title has not prevented that page from appearing in the report’s cited set.
This is a concrete reason to inspect comparison and directory coverage. Check whether the company is included, whether descriptions are accurate, which projects are named and whether the evidence is current. Publishing a new annual list is not a substitute for understanding the pages already being cited.
The domain view adds another layer. It lists balitecture.com with 149, kingswoodbalivillas.com with 105, and magnumestate.com with 78 in their displayed citation counts.
Competitor sites participate as information sources as well as brands. A citation review should therefore establish who owns and authored each influential page. A directory, a publisher and a competitor’s own comparison article require different scrutiny; appearing under another domain does not automatically make evidence independent.
The pages describing the market deserve attention alongside the companies competing in it.
6. Citation mix — more owned content is only part of the task
Teville’s citation mix contains 24.3% own-domain sources, compared with 6.3% for Royal Bali Group. Yet the report’s “Others” category remains the majority for both: 73.8% and 92.8%, respectively.
Alex Villas has a different balance: 22.5% social sources and 1.3% own-domain sources. Coco Development Group records 14.4% social and 11.0% own-domain.
These proportions suggest different audit priorities. Teville should inspect which owned pages are useful enough to enter cited answers and whether adjacent buyer questions have comparable evidence. Royal Bali Group should examine the accuracy and provenance of the other sources describing it. Alex Villas should review whether important information found on social platforms is also available in a stable, current form on its own site.
A larger owned share is not automatically a better result. The goal is accurate, relevant evidence across the sources a buyer’s answer uses. “Others” is a source category, not a certification of editorial independence.
7. Technical signals — fix obstacles without treating them as a ranking formula
The technical panel reports 192 common issues, including 78 missing or invalid structured-data issues, 40 content-readability issues, and 19 AI crawler access-rule issues. It also lists 31 AI-assistant-guideline issues, 10 page-discovery issues and 14 content-feed issues.
That is a remediation queue to investigate. Start with whether intended public pages can be accessed and whether their core facts are available as readable text. Check structured data against the visible content, then verify the relevant discovery paths. Treat each audit flag as something to diagnose, rather than a promise of improved AI placement.
Backlinks provide another useful distinction. Balitecture has 16.5K backlinks and 201 refs, while Ciputra Group has 5.5K backlinks and 654 refs. A greater total link count and a broader referring-source footprint are different properties.
Nor does link volume reproduce the Visibility ordering. Ciputra records 5.7% Visibility in the other-players table, while Magnum records 43.8% on the podium despite a displayed backlink count of 353. The earlier podium and other-players images provide those separate Visibility figures.
For a developer, the practical review should focus on relevant referring pages, factual descriptions and accessible project evidence. Raw link totals alone do not explain the observed AI results.
8. The next 90 days — turn the gaps into a testable programme
Days 1–30: establish the buyer-question baseline.
Build separate test groups for developer comparisons, reliable construction for foreign owners, turnkey budgets, investment assumptions and buyer experiences. Run a consistent set across ChatGPT, Perplexity, Google AI and Claude. Record presence, position and exact citations separately. Include Alpha Partner Bali, Teville, Atmosphera and Royal Bali Group where relevant, alongside the podium and Share of Voice leaders.
The deliverable is a question-by-engine evidence log, with brand names and domains checked for duplicate entities before any totals are combined.
Days 31–60: repair the evidence for two priority intents.
Choose two buyer concerns that match the company’s actual offering. Publish or improve the supporting material: for example, a documented handover case for reliability and a dated package-scope page for budget questions. Check access, readable content and relevant structured data on those pages.
In parallel, review the comparison and directory pages already cited. Document inaccurate descriptions and request factual corrections where appropriate. Record page ownership and authorship before treating any source as independent confirmation.
Days 61–90: repeat the same tests and inspect what changed.
Rerun the original questions across the same engines. Check whether missing-provider appearances changed, whether rare mentions became more frequent and whether positions or cited sources shifted. Keep changes in Visibility, Share of Voice and source mix separate.
The result should be a documented comparison of answers and evidence, with clear priorities for the next cycle. It should not depend on assuming that one technical fix or one new article caused every movement.
Want this scoreboard for your own brand? Run a free audit at tryera.ai/free-report — 30 minutes, your numbers, no deck required.
Full report with source data: Real estate developers in Bali.