How AI Customer Support Platforms Rank in AI Search: A Deep Analysis of Intercom, Fin, Zendesk and the Challengers
Intercom and Fin.ai appear in 77.3% and 74.2% of AI answers about AI customer support platforms, and no other ranked brand passes 19.2%. Yet Zendesk holds the largest share of voice, and the most-cited individual pages are third-party "best of" lists rather than vendor sites.
Intercom and Fin.ai appear in 77.3% and 74.2% of AI answers about AI customer support platforms, and no other ranked brand passes 19.2%. Yet Zendesk holds the largest share of voice, and the most-cited individual pages are third-party "best of" lists rather than vendor sites.
When a support leader asks ChatGPT, Perplexity, Google AI or Claude which platform to buy, the answer arrives as a shortlist. Being on that shortlist, early, and on the engine your buyers actually use, is now part of the sales cycle. Era's report tracks how AI customer support platforms appear across those four engines: visibility, share of voice, average position, citations, the sources and pages behind the answers, the queries that surface each brand, backlinks and technical readiness. These measures do not collapse into one ranking. The brand present in the most answers is not the brand with the largest share of voice, and the domain with the most backlinks sits at 5.6% visibility.
Ask an AI engine for the best AI customer support platform and you get two leaders at once: Intercom and Zendesk. They simply come from different scoreboards.
On Visibility, Intercom leads with 77.3% of answers. On Share of Voice, Zendesk leads with 16.9%, 0.2 points ahead of Intercom. Zendesk does not appear in the report's 18-row ranked scoreboard at all. Meanwhile the company behind Intercom holds the top two podium places under two different names.
For anyone selling support software, the practical question is not "where do we rank?" but "which lens, which engine and which buyer question?"
1. Share of voice — The conversation leader is missing from the scoreboard
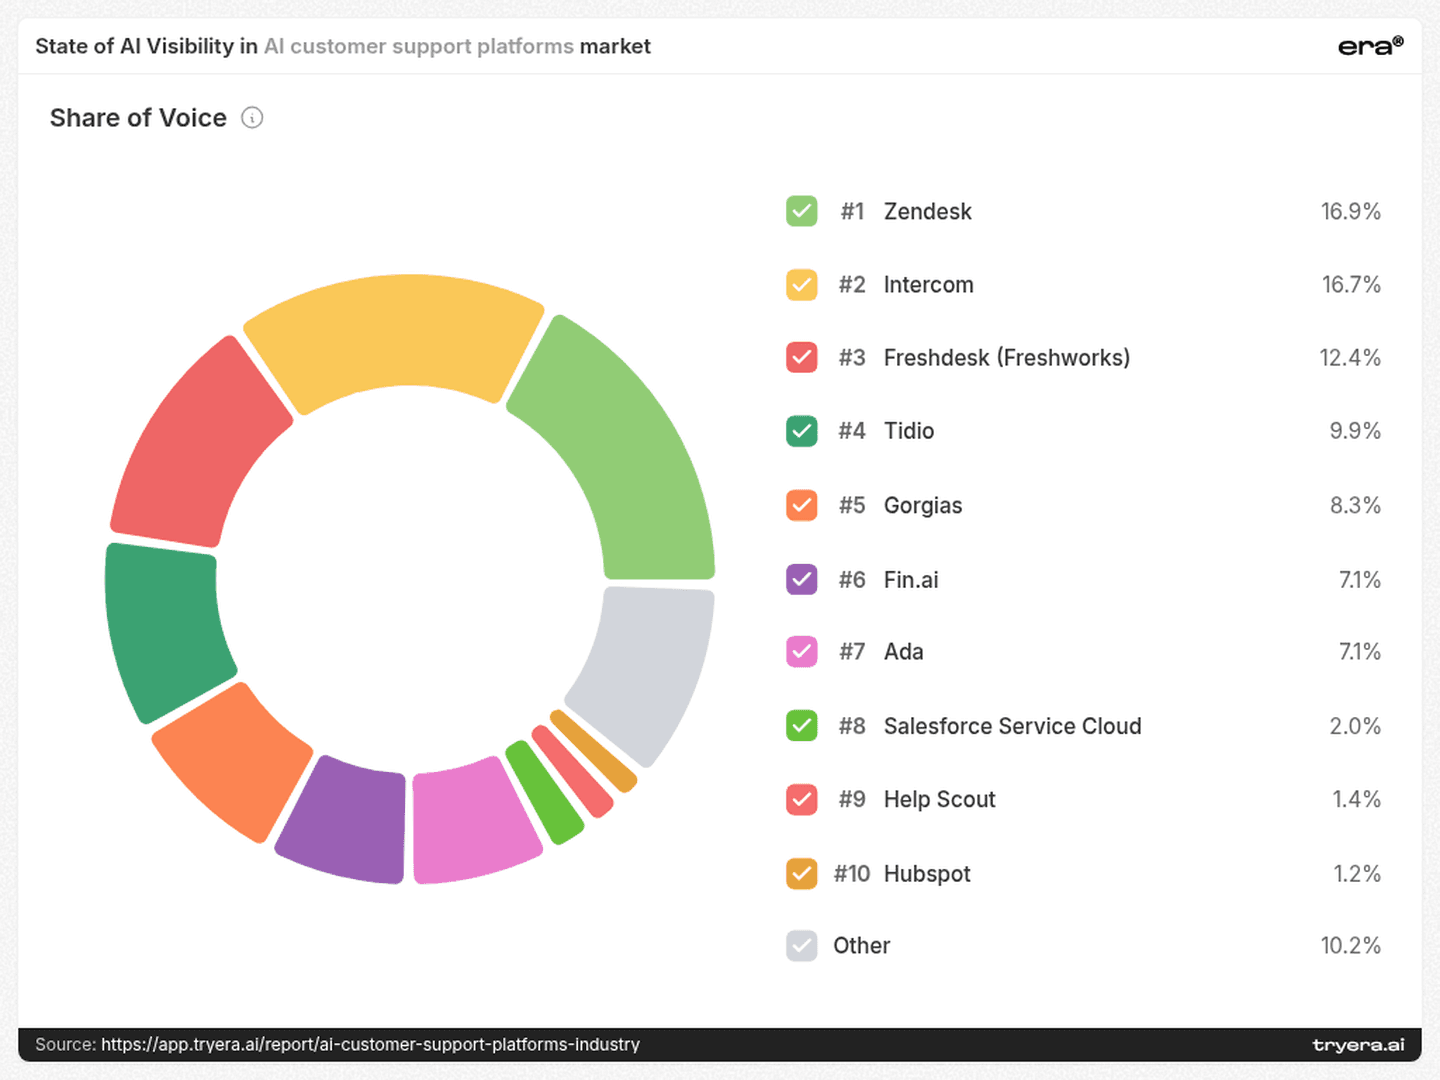
The share-of-voice chart reads like a market map most support leaders would recognise:
Zendesk — 16.9%
Intercom — 16.7%
Freshdesk (Freshworks) — 12.4%
Tidio — 9.9%
Gorgias — 8.3%
Fin.ai and Ada — 7.1% each
Seven brands hold at least 7.1% of the conversation. Five of them (Zendesk, Freshdesk, Tidio, Gorgias and Ada) are absent from the ranked scoreboard of 18 players. Together, those five account for 54.6% of share of voice. Salesforce Service Cloud (2.0%) is missing from the ranked rows too.
These brands are not absent from the answers' evidence either. zendesk.com is the second most-cited source domain in the report (140 citations), freshworks.com is fourth (123) and gorgias.com is fifth (77).
Share of voice measures how much of the conversation a brand owns. Visibility measures how often it is there at all. In this category, the two crown different leaders.
The implication is simple: a benchmark built on one table would miss more than half of the category's AI conversation. Teams should read both lenses before deciding who they are actually competing against.
2. The podium — One company, two names, a 55-point lead
The ranked podium is dominated by two entities:
Intercom — 77.3% Visibility, 16.7% SoV, average Rank #1.4, 453 citations
Fin.ai — 74.2% Visibility, 7.1% SoV, average Rank #2.3, 397 citations
Help Scout — 19.2% Visibility, then HubSpot (14.6%) and ServiceNow (8.6%)

Fin's own about page states that the company was renamed from Intercom to Fin, while Intercom remains its helpdesk product. AI engines and this report treat Intercom and Fin.ai as separate entities, so their numbers should not be added together: the overlap between the two is unknown.
What the split does show is how differently the two names behave. Fin.ai appears in almost as many answers as Intercom, but later (#2.3 vs #1.4) and with less than half of Intercom's share of voice. For a company in the middle of a rename, that is a measurable question: which name do buyers' prompts trigger, and which name do the answers recommend first?
For everyone else, the 55.0-point gap between Fin.ai (74.2%) and Help Scout (19.2%) defines the real contest. In this report, places three to five are where challengers can realistically move.
3. Engine gaps — "How visible are we?" needs a follow-up: "Where?"
The heatmap shows that even the leaders are uneven. Intercom reaches 90.0% on Perplexity and 88.0% on ChatGPT, but 58.0% on Claude. Fin.ai follows the same shape: 88.0% on ChatGPT and 56.0% on Claude.
Below the leaders, each brand has a different strongest engine:
HubSpot: 27.1% on Google AI, 8.0% on Perplexity
Help Scout: 26.0% on Claude, 8.0% on Perplexity
Zoho Desk: 24.0% on Claude, 4.2% on Google AI
Amazon Web Services: 22.0% on ChatGPT, 6.0–8.3% elsewhere
ServiceNow: 14.0% on Perplexity, 2.1% on Google AI
Fini: 20.0% on Claude, 0.0% on ChatGPT
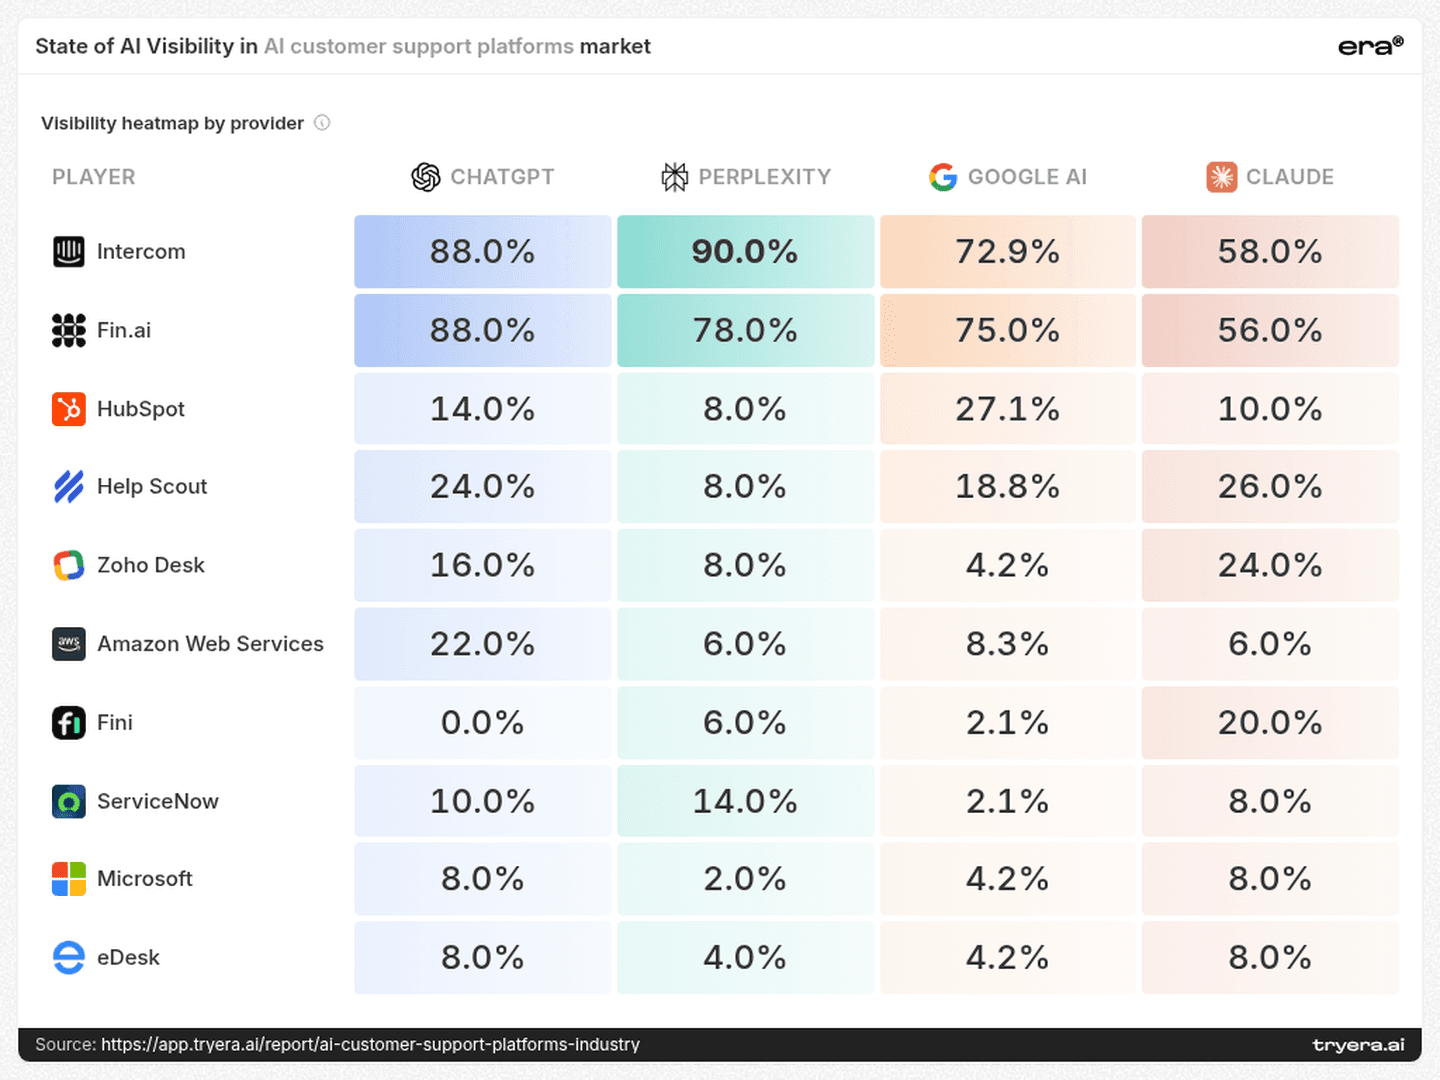
Claude is the engine where the leaders are weakest and where several challengers are strongest. Help Scout's 26.0% on Claude sits 32 points behind Intercom. On Perplexity, the same gap is 82 points.
On Claude, the distance between #1 and #3 is 32 points. On Perplexity, it is 82.
A single blended visibility number hides this. A challenger looking for its first realistic win should start with the engine where it is already competitive, not the one where the leaders are strongest.
4. Buyer intent — Three questions, three competitive sets
The players' top queries split the category into three distinct buyer conversations:
Small business. Intercom's top query is "best AI customer support platforms small business 2026". Help Scout and Zoho Desk share "best AI customer support platforms small businesses 2026", and HubSpot's top query adds pricing to the small-business question.
Ecommerce. Fin.ai, Fini and eDesk share "best AI customer support platforms ecommerce 2026". Amazon Web Services surfaces on "best AI customer service software ecommerce 2026 comparison".
Public sector. ServiceNow and Microsoft both surface on a query for the best AI support platforms for government agencies and the public sector.
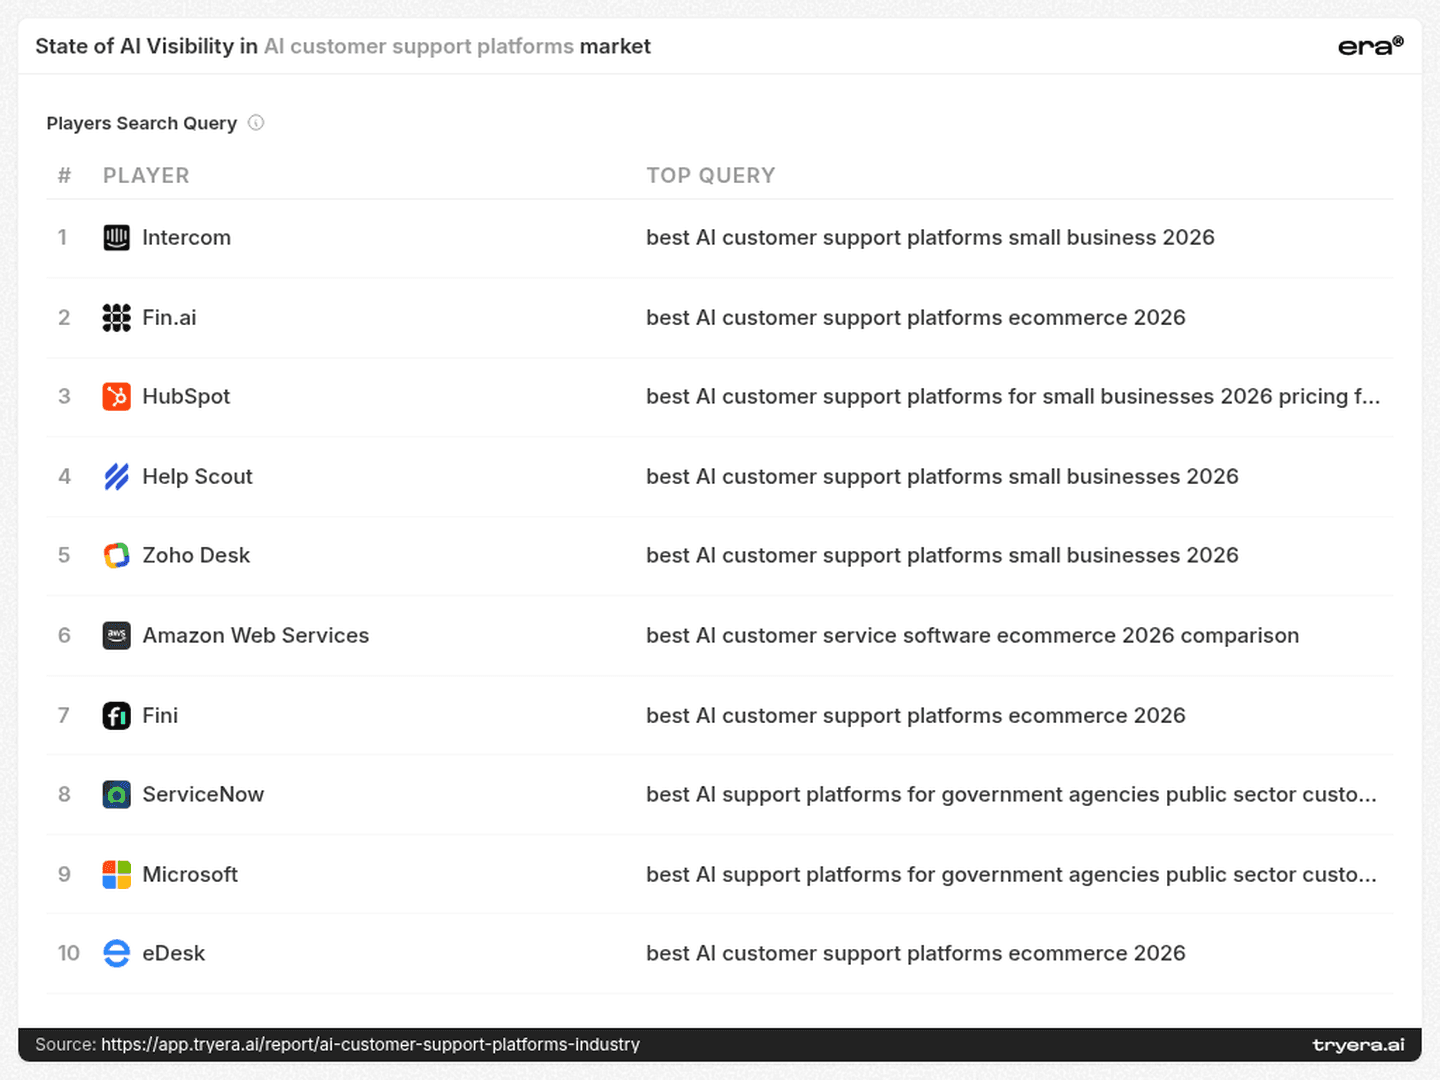
The brands sharing a query compete for the same answer, even when their overall engine profiles differ. Fini and Fin.ai are a clear example: same top query, very different report-wide visibility. Whether that gap holds on the ecommerce query itself is worth testing separately.
The search-volume page adds a regulated-buyer layer. Next to brand and platform terms such as reddit (208.9K), genesys (190.3K) and g2 (22.9K), it lists "hipaa compliant" (6.5K), "fedramp" (1.5K) and "gartner magic quadrant" (362).
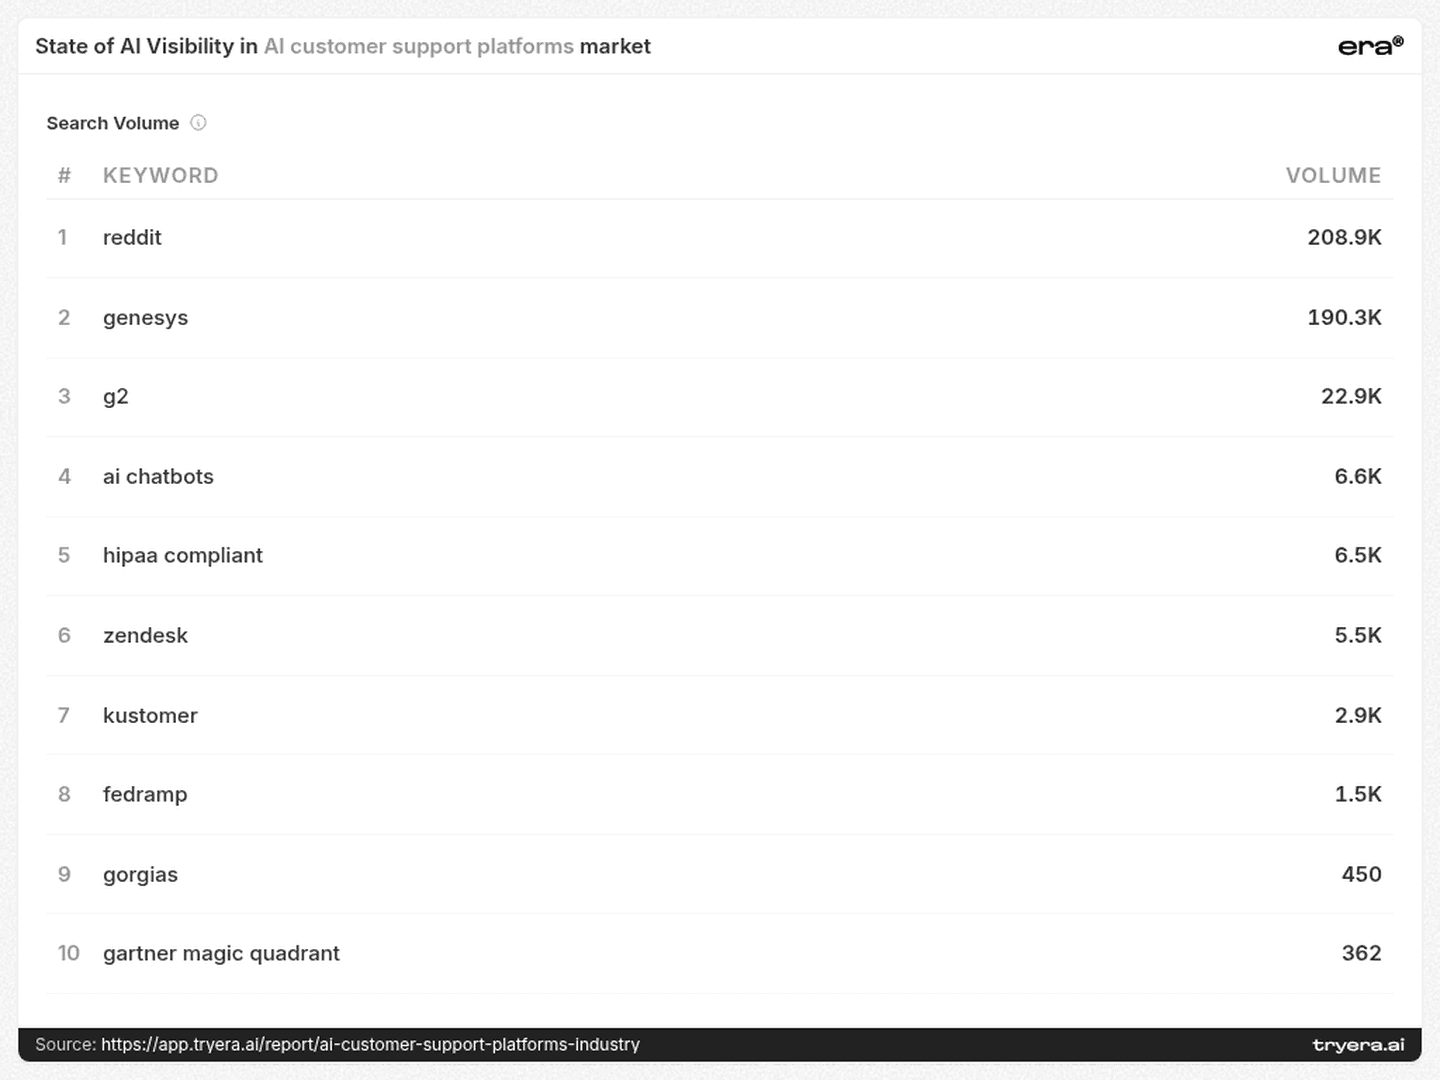
Compliance vocabulary sits close to the public-sector intent that ServiceNow and Microsoft surface on. For vendors selling into healthcare or government, the evidence an AI engine can find on HIPAA and FedRAMP is worth checking before any broader content push.
5. Sources — Lists write the shortlist, vendors supply the detail
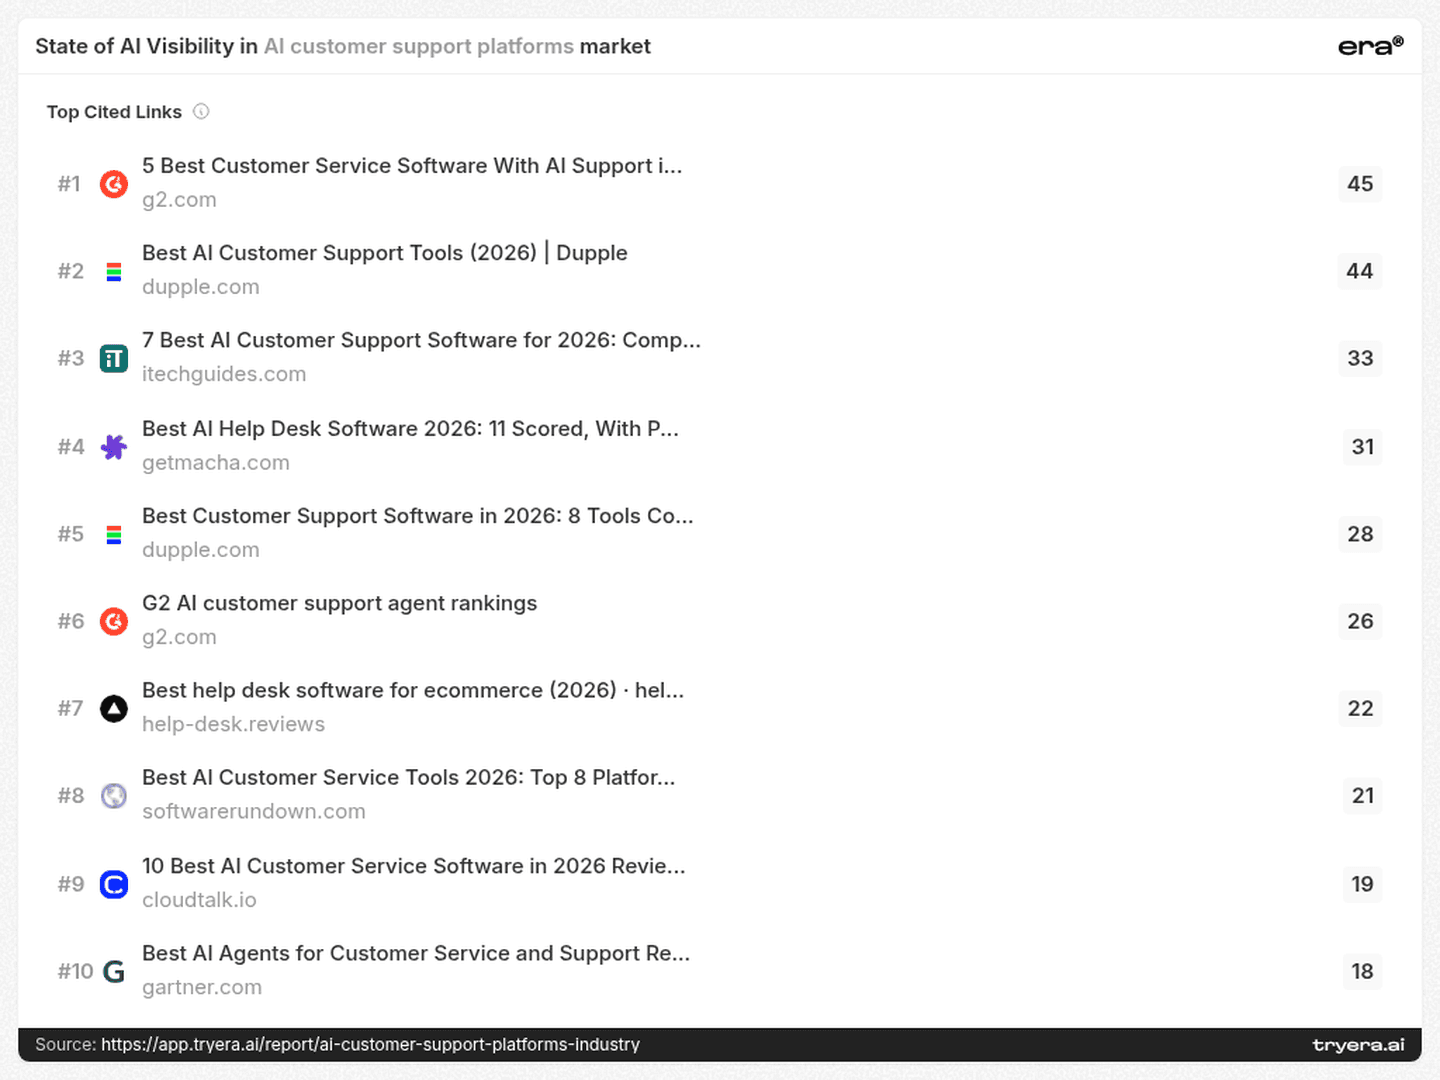
Every one of the ten most-cited pages in this report is a ranking or "best of" page:
G2: "5 Best Customer Service Software With AI Support…" — 45 citations
Dupple: "Best AI Customer Support Tools (2026)" — 44
itechguides: "7 Best AI Customer Support Software for 2026…" — 33
getmacha.com: "Best AI Help Desk Software 2026: 11 Scored…" — 31
G2 AI customer support agent rankings — 26
help-desk.reviews: "Best help desk software for ecommerce (2026)…" — 22
Gartner: "Best AI Agents for Customer Service and Support…" — 18
G2 and Dupple each have two pages in the top ten.
At the domain level, the picture flips. Nine of the ten most-cited source domains belong to vendors: intercom.com (20.9%, 207), zendesk.com (14.1%, 140), freshworks.com (12.4%, 123), gorgias.com (7.8%, 77), usefini.com (7.4%, 73), sobot.io (6.4%, 63), salesforce.com (6.3%, 62), tidio.com (5.9%, 58) and fin.ai (5.1%, 50). g2.com (13.8%, 137) is the only third-party domain on the list.
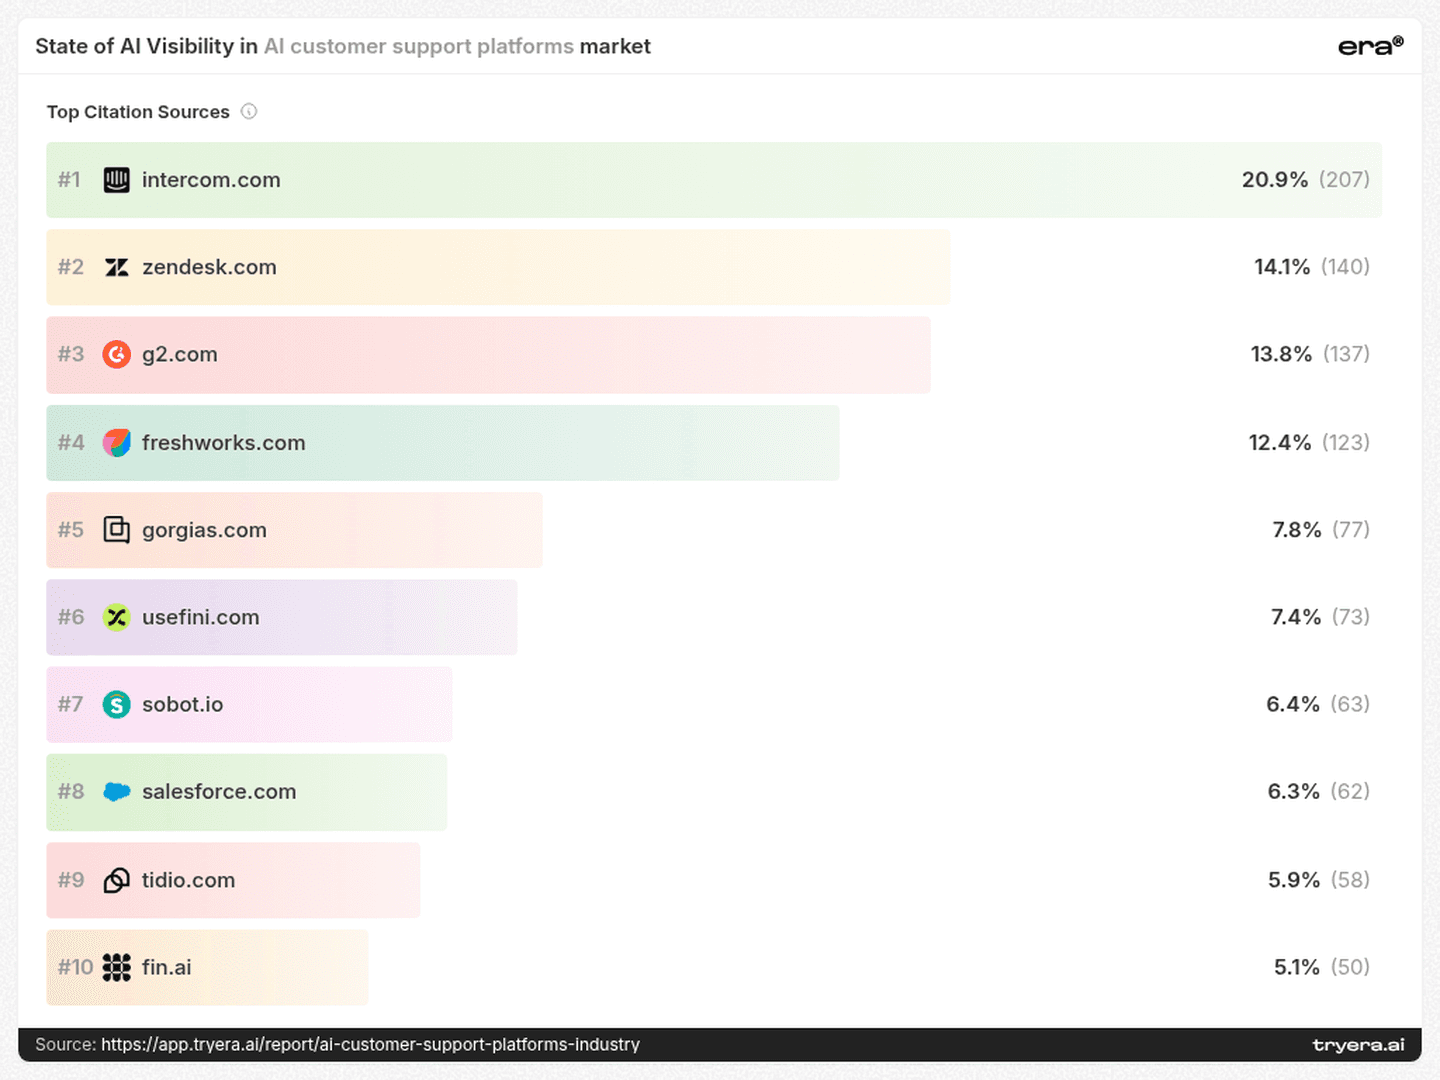
The most-cited pages are lists. The most-cited domains are vendors. Both end up in the answer.
Two names stand out. usefini.com and sobot.io are cited more often than salesforce.com, although Fini appears in 7.1% of answers and Sobot is not among the ranked players or the top ten in share of voice. A vendor's site can become a source for the category even when the vendor itself is rarely recommended. For smaller players, that is an opening worth studying: which of their pages do engines quote, and on which questions?
6. Citation mix — Where each brand's evidence comes from
For every tracked player, most citations come from third-party sources, from 60.2% (ServiceNow) to 89.4% (Fini). The differences sit in the remaining share:
HubSpot has the largest social share at 17.4%, followed by ServiceNow at 16.1%.
Fini has 0.0% social and 89.4% other sources, with 10.6% from its own domain.
eDesk (1.1% social) and Amazon Web Services (3.2%) rely on their own domains and third-party pages, with almost no social presence.
Intercom (21.3% / 9.4% / 69.2%) and Fin.ai (21.6% / 9.7% / 68.8%) have almost identical mixes.
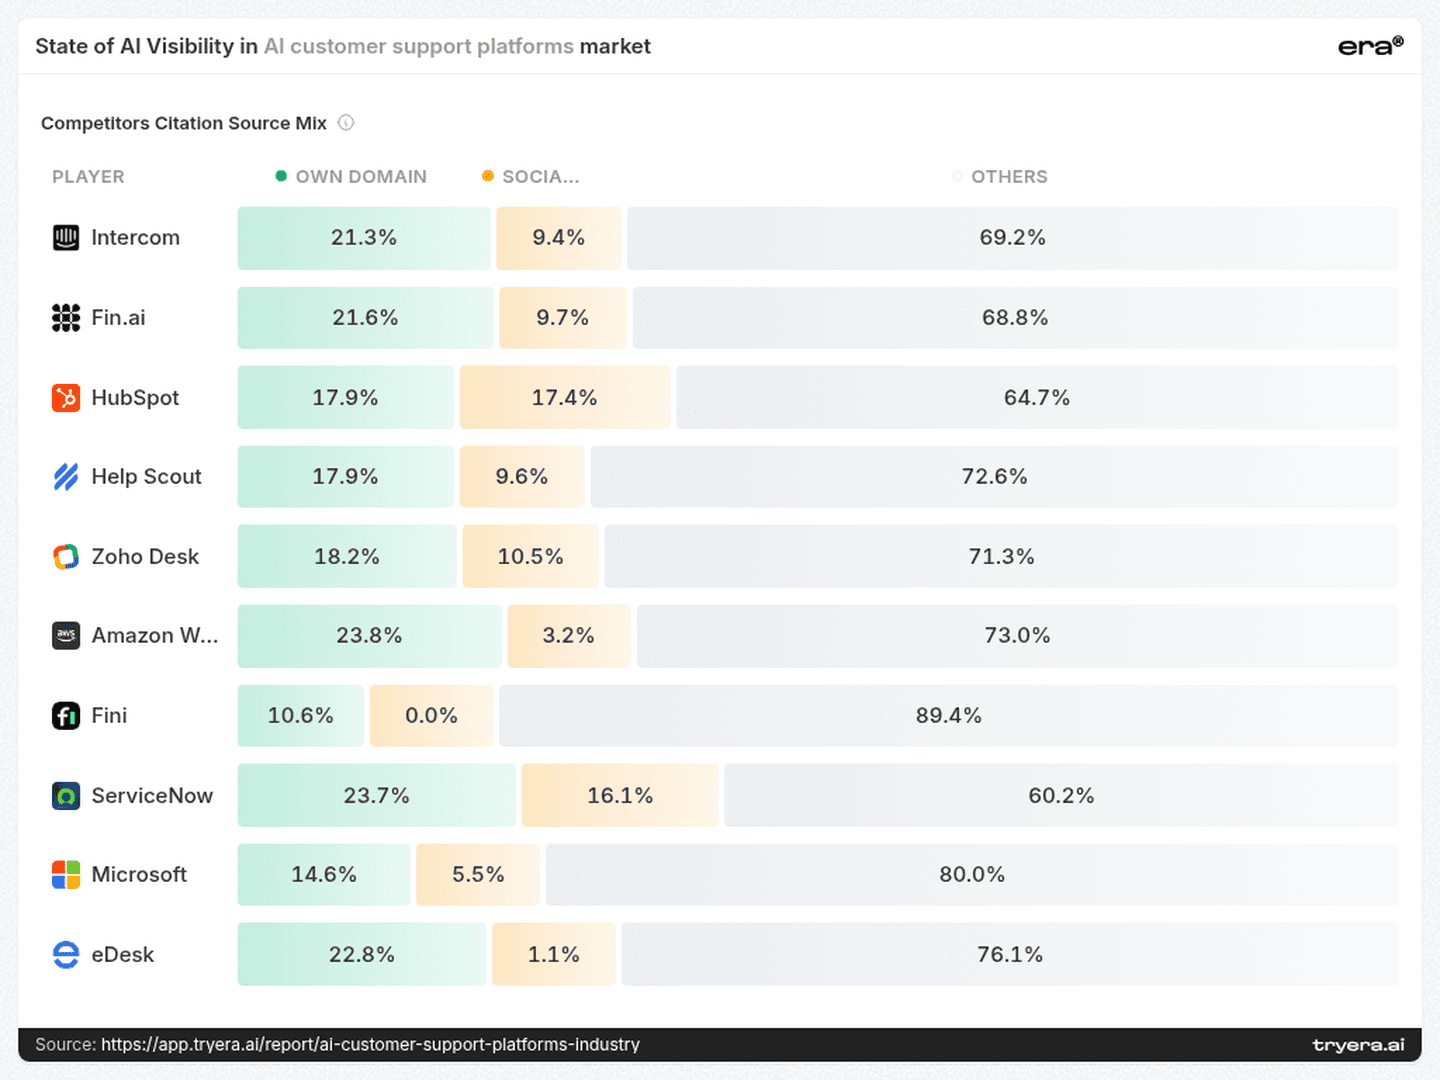
A near-zero social share is not automatically a problem. But reddit is the highest-volume keyword on the report's search-volume page, so brands with almost no social evidence should at least check whether community discussions mention them, and how.
7. Authority and hygiene — Backlinks and audits measure something else
The backlink ranking looks nothing like the visibility ranking. Microsoft leads with 588.7M backlinks from 2.7M referring domains, and Zendesk follows with 525.8M. Tidio closes the list of ten with 1.5M. Intercom, the visibility leader, is not among the ten domains on the page.
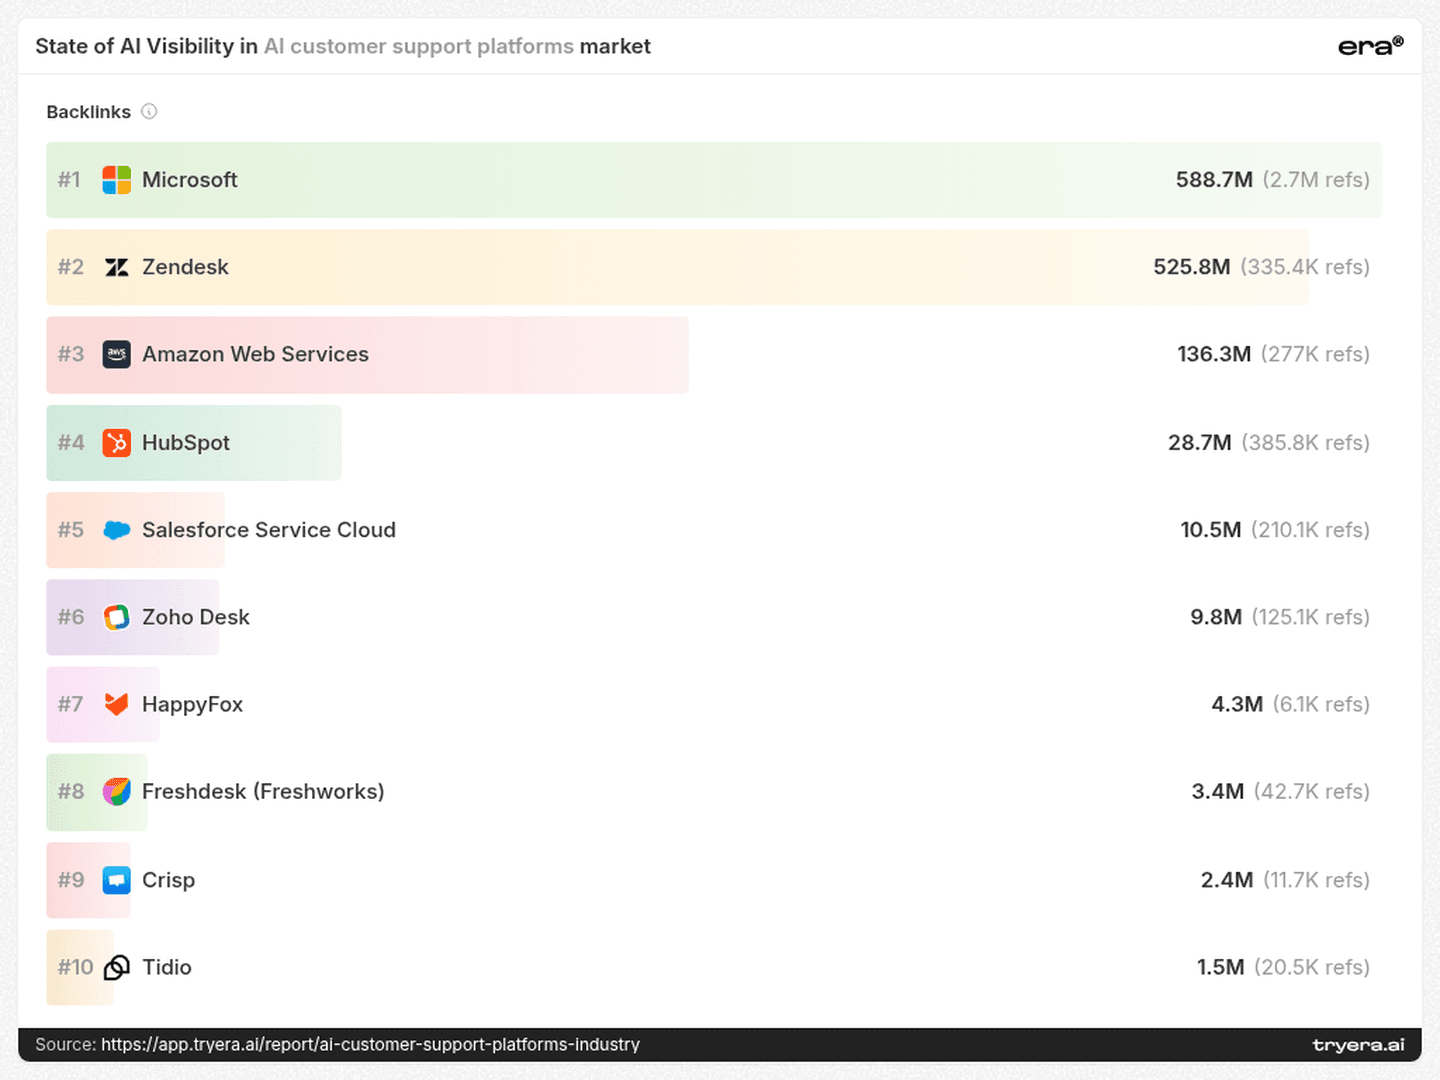
Set against the other pages, the contrast is sharp: Microsoft's visibility is 5.6%, while Tidio holds 9.9% share of voice. HappyFox appears on the backlink page with 4.3M backlinks but not in the ranked scoreboard or the share-of-voice top ten.
The competitive landscape tells a similar story. Most tracked players cluster between roughly 50 and 75 on the technical audit score, yet their visibility scores sit far below Intercom and Fin.ai. Microsoft is the outlier, far to the left on technical readiness.
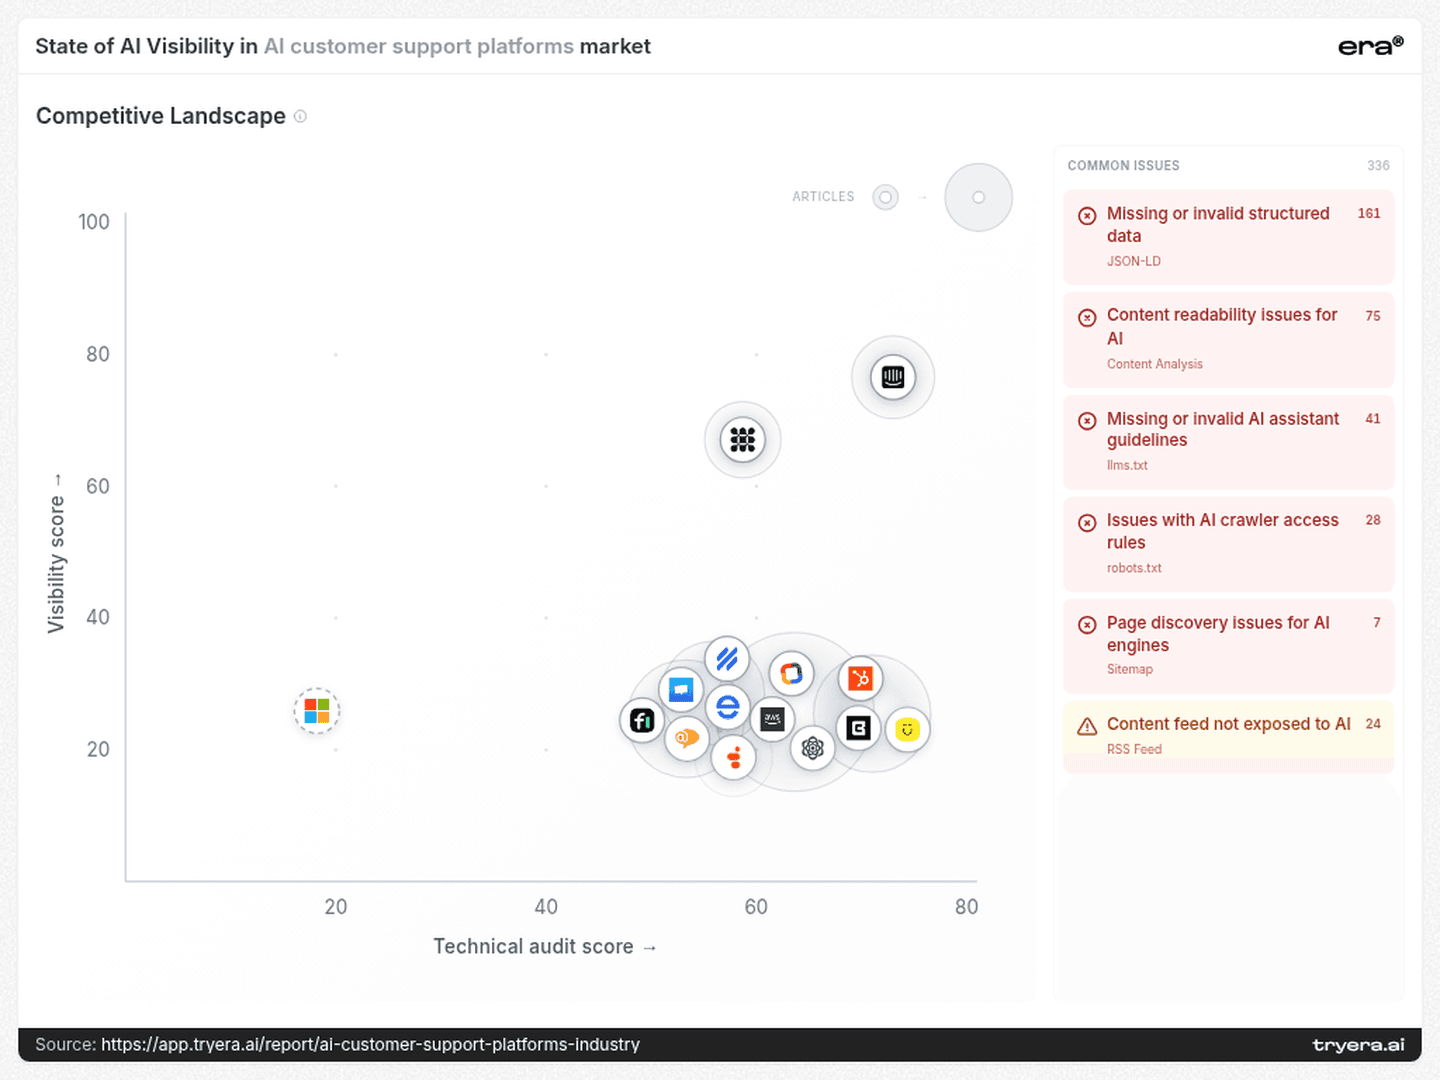
Across the audited sites, the report counts 336 common issues: 161 missing or invalid structured data (JSON-LD), 75 content readability issues for AI, 41 missing or invalid AI assistant guidelines (llms.txt), 28 AI crawler access issues (robots.txt), 24 content feeds not exposed to AI and 7 page discovery issues.
Similar technical scores produce very different visibility. Hygiene is the entry ticket, not the differentiator.
Fixing structured data and crawler access is cheap and worth doing. It is unlikely, on its own, to explain a 50-point visibility gap.
8. Beyond the leaders — Where nine brands could focus next
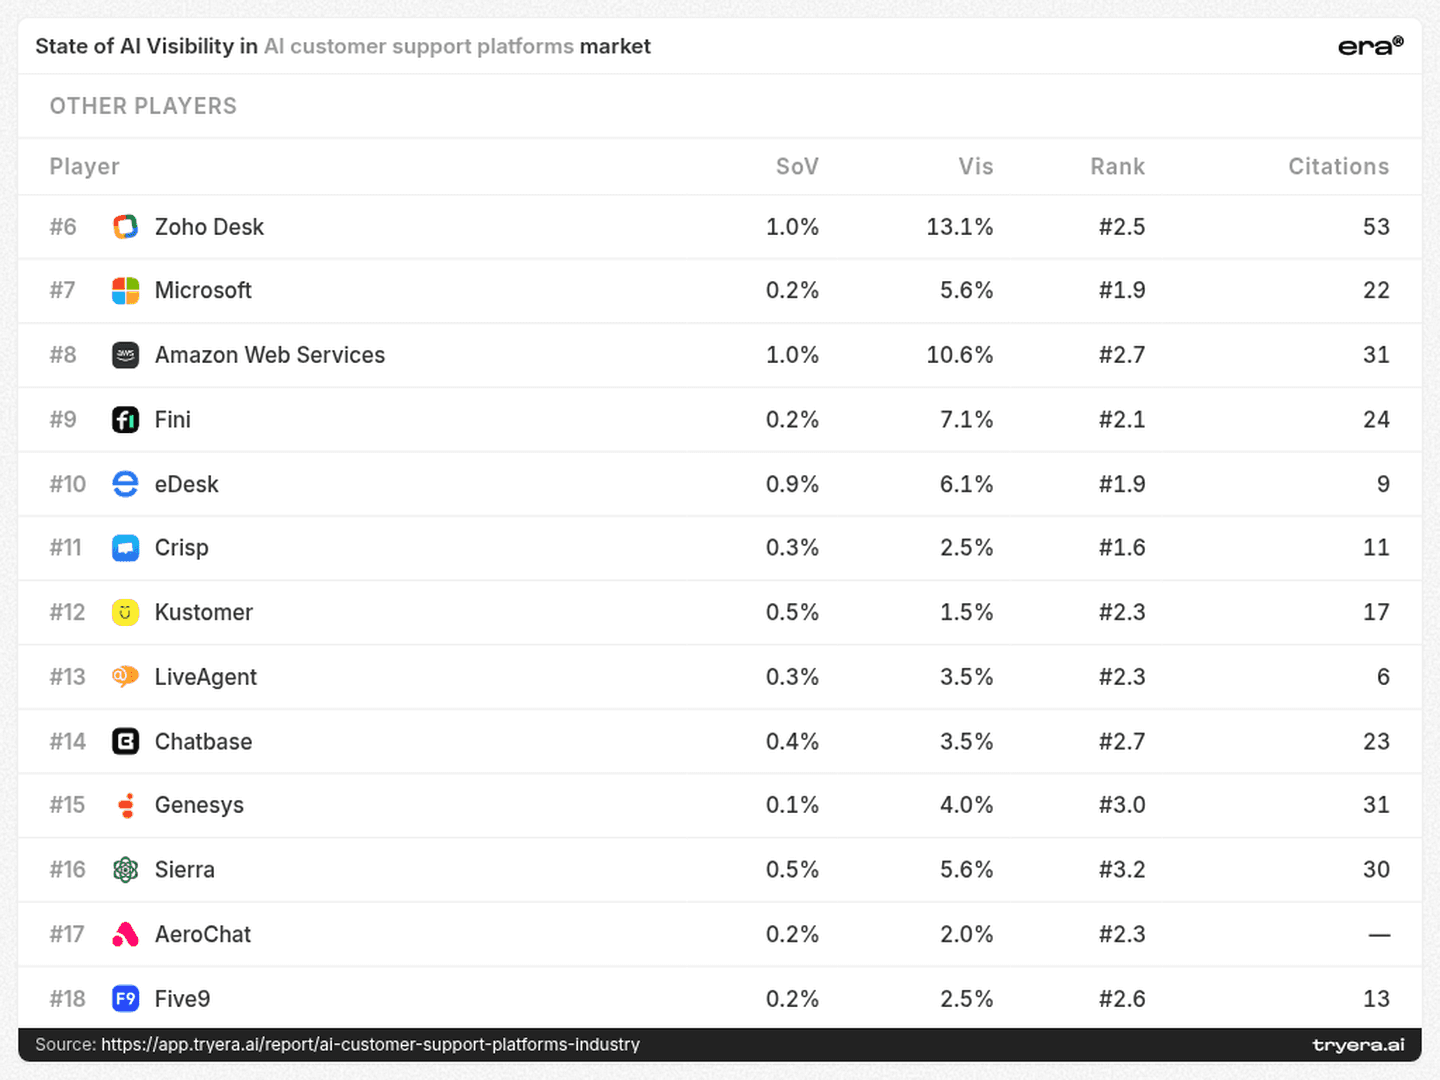
The ranked rows from #6 to #18 hold brands with very different situations. Nine of them show a specific result worth investigating.
Early when they appear: Crisp, eDesk and Microsoft
Crisp appears in only 2.5% of answers, but its average Rank is #1.6, the earliest among rows #6–#18. eDesk (6.1% Visibility) and Microsoft (5.6%) both average #1.9. When these brands are included, they tend to come early.
The gap is frequency. For Crisp, the next step is to map the prompts where it already appears and test whether that early position holds on adjacent buyer questions. eDesk has only 9 citations and a 1.1% social share, while its top query is the ecommerce one; checking its presence in ecommerce lists such as help-desk.reviews, a top-cited page, is a concrete place to start. Microsoft surfaces on the public-sector query and has the most backlinks in the report, but sits furthest left on technical readiness. The audit issues on the pages AI engines read are the obvious first check.
One engine, real traction: Fini and Zoho Desk
Fini reaches 20.0% on Claude and 0.0% on ChatGPT. Its domain, usefini.com, is the sixth most-cited source in the report. That is a real strength on one engine and a clear question on another. Fini shares its ecommerce top query with Fin.ai and eDesk, so testing that exact query on ChatGPT is the natural next step.
Zoho Desk has 13.1% Visibility, more than ServiceNow (8.6%) on the podium. It is strongest on Claude (24.0%) and ChatGPT (16.0%) and weakest on Google AI (4.2%). The Google AI gap is the specific thing to investigate: which pages Google AI cites for the small-business query Zoho Desk shares with Help Scout.
Name demand, thin AI presence: Genesys and Kustomer
"genesys" is the second-highest keyword on the search-volume page at 190.3K, yet Genesys holds 4.0% Visibility, 0.1% SoV and an average Rank of #3.0. "kustomer" carries 2.9K, while Kustomer sits at 1.5% Visibility.
Search demand for a name does not translate into a place in category answers. For both, the question is how engines frame them when buyers ask for AI customer support platforms, and whether the brand's own pages describe that use case in the buyer's words.
Present, but late: Sierra and Five9
Sierra has 5.6% Visibility and 30 citations, but an average Rank of #3.2, the latest in the ranked table. Five9 appears in 2.5% of answers at #2.6. Both are cited and included, but tend to appear further down the answer. Reading the specific answers where they appear would show whether they are recommended or listed as alternatives.
9. A 90-day plan — What to test next
Days 1–30: Measure the right things
Track Visibility and Share of Voice separately, per engine. This category proves they disagree.
Identify which of the three buyer intents (small business, ecommerce, public sector) your top query belongs to.
List the top cited "best of" pages for your intent and check whether you are included and described accurately.
Fix the baseline: JSON-LD, AI crawler access in robots.txt and llms.txt.
Days 31–60: Build evidence for one intent
Create or update the page an engine would need to answer your intent: small-business pricing, ecommerce integrations or public-sector compliance (HIPAA, FedRAMP).
Review your profile on G2, the only third-party domain among the top ten sources.
If your social share is near zero, check how community discussions describe your product.
Days 61–90: Re-test where you are closest
Re-run your top query on each engine and compare against your weakest engine.
If your brand runs under more than one name, check which name answers recommend first.
Prioritise the engine where you already have traction over the one where the leaders are strongest.
Want this scoreboard for your own brand? Run a free audit at tryera.ai/free-report — 30 minutes, your numbers, no deck required.
Full report with source data: AI customer support platforms.



When a support leader asks ChatGPT, Perplexity, Google AI or Claude which platform to buy, the answer arrives as a shortlist. Being on that shortlist, early, and on the engine your buyers actually use, is now part of the sales cycle. Era's report tracks how AI customer support platforms appear across those four engines: visibility, share of voice, average position, citations, the sources and pages behind the answers, the queries that surface each brand, backlinks and technical readiness. These measures do not collapse into one ranking. The brand present in the most answers is not the brand with the largest share of voice, and the domain with the most backlinks sits at 5.6% visibility.
Ask an AI engine for the best AI customer support platform and you get two leaders at once: Intercom and Zendesk. They simply come from different scoreboards.
On Visibility, Intercom leads with 77.3% of answers. On Share of Voice, Zendesk leads with 16.9%, 0.2 points ahead of Intercom. Zendesk does not appear in the report's 18-row ranked scoreboard at all. Meanwhile the company behind Intercom holds the top two podium places under two different names.
For anyone selling support software, the practical question is not "where do we rank?" but "which lens, which engine and which buyer question?"
1. Share of voice — The conversation leader is missing from the scoreboard
The share-of-voice chart reads like a market map most support leaders would recognise:
Zendesk — 16.9%
Intercom — 16.7%
Freshdesk (Freshworks) — 12.4%
Tidio — 9.9%
Gorgias — 8.3%
Fin.ai and Ada — 7.1% each
Seven brands hold at least 7.1% of the conversation. Five of them (Zendesk, Freshdesk, Tidio, Gorgias and Ada) are absent from the ranked scoreboard of 18 players. Together, those five account for 54.6% of share of voice. Salesforce Service Cloud (2.0%) is missing from the ranked rows too.
These brands are not absent from the answers' evidence either. zendesk.com is the second most-cited source domain in the report (140 citations), freshworks.com is fourth (123) and gorgias.com is fifth (77).
Share of voice measures how much of the conversation a brand owns. Visibility measures how often it is there at all. In this category, the two crown different leaders.
The implication is simple: a benchmark built on one table would miss more than half of the category's AI conversation. Teams should read both lenses before deciding who they are actually competing against.
2. The podium — One company, two names, a 55-point lead
The ranked podium is dominated by two entities:
Intercom — 77.3% Visibility, 16.7% SoV, average Rank #1.4, 453 citations
Fin.ai — 74.2% Visibility, 7.1% SoV, average Rank #2.3, 397 citations
Help Scout — 19.2% Visibility, then HubSpot (14.6%) and ServiceNow (8.6%)
Fin's own about page states that the company was renamed from Intercom to Fin, while Intercom remains its helpdesk product. AI engines and this report treat Intercom and Fin.ai as separate entities, so their numbers should not be added together: the overlap between the two is unknown.
What the split does show is how differently the two names behave. Fin.ai appears in almost as many answers as Intercom, but later (#2.3 vs #1.4) and with less than half of Intercom's share of voice. For a company in the middle of a rename, that is a measurable question: which name do buyers' prompts trigger, and which name do the answers recommend first?
For everyone else, the 55.0-point gap between Fin.ai (74.2%) and Help Scout (19.2%) defines the real contest. In this report, places three to five are where challengers can realistically move.
3. Engine gaps — "How visible are we?" needs a follow-up: "Where?"
The heatmap shows that even the leaders are uneven. Intercom reaches 90.0% on Perplexity and 88.0% on ChatGPT, but 58.0% on Claude. Fin.ai follows the same shape: 88.0% on ChatGPT and 56.0% on Claude.
Below the leaders, each brand has a different strongest engine:
HubSpot: 27.1% on Google AI, 8.0% on Perplexity
Help Scout: 26.0% on Claude, 8.0% on Perplexity
Zoho Desk: 24.0% on Claude, 4.2% on Google AI
Amazon Web Services: 22.0% on ChatGPT, 6.0–8.3% elsewhere
ServiceNow: 14.0% on Perplexity, 2.1% on Google AI
Fini: 20.0% on Claude, 0.0% on ChatGPT
Claude is the engine where the leaders are weakest and where several challengers are strongest. Help Scout's 26.0% on Claude sits 32 points behind Intercom. On Perplexity, the same gap is 82 points.
On Claude, the distance between #1 and #3 is 32 points. On Perplexity, it is 82.
A single blended visibility number hides this. A challenger looking for its first realistic win should start with the engine where it is already competitive, not the one where the leaders are strongest.
4. Buyer intent — Three questions, three competitive sets
The players' top queries split the category into three distinct buyer conversations:
Small business. Intercom's top query is "best AI customer support platforms small business 2026". Help Scout and Zoho Desk share "best AI customer support platforms small businesses 2026", and HubSpot's top query adds pricing to the small-business question.
Ecommerce. Fin.ai, Fini and eDesk share "best AI customer support platforms ecommerce 2026". Amazon Web Services surfaces on "best AI customer service software ecommerce 2026 comparison".
Public sector. ServiceNow and Microsoft both surface on a query for the best AI support platforms for government agencies and the public sector.
The brands sharing a query compete for the same answer, even when their overall engine profiles differ. Fini and Fin.ai are a clear example: same top query, very different report-wide visibility. Whether that gap holds on the ecommerce query itself is worth testing separately.
The search-volume page adds a regulated-buyer layer. Next to brand and platform terms such as reddit (208.9K), genesys (190.3K) and g2 (22.9K), it lists "hipaa compliant" (6.5K), "fedramp" (1.5K) and "gartner magic quadrant" (362).
Compliance vocabulary sits close to the public-sector intent that ServiceNow and Microsoft surface on. For vendors selling into healthcare or government, the evidence an AI engine can find on HIPAA and FedRAMP is worth checking before any broader content push.
5. Sources — Lists write the shortlist, vendors supply the detail
Every one of the ten most-cited pages in this report is a ranking or "best of" page:
G2: "5 Best Customer Service Software With AI Support…" — 45 citations
Dupple: "Best AI Customer Support Tools (2026)" — 44
itechguides: "7 Best AI Customer Support Software for 2026…" — 33
getmacha.com: "Best AI Help Desk Software 2026: 11 Scored…" — 31
G2 AI customer support agent rankings — 26
help-desk.reviews: "Best help desk software for ecommerce (2026)…" — 22
Gartner: "Best AI Agents for Customer Service and Support…" — 18
G2 and Dupple each have two pages in the top ten.
At the domain level, the picture flips. Nine of the ten most-cited source domains belong to vendors: intercom.com (20.9%, 207), zendesk.com (14.1%, 140), freshworks.com (12.4%, 123), gorgias.com (7.8%, 77), usefini.com (7.4%, 73), sobot.io (6.4%, 63), salesforce.com (6.3%, 62), tidio.com (5.9%, 58) and fin.ai (5.1%, 50). g2.com (13.8%, 137) is the only third-party domain on the list.
The most-cited pages are lists. The most-cited domains are vendors. Both end up in the answer.
Two names stand out. usefini.com and sobot.io are cited more often than salesforce.com, although Fini appears in 7.1% of answers and Sobot is not among the ranked players or the top ten in share of voice. A vendor's site can become a source for the category even when the vendor itself is rarely recommended. For smaller players, that is an opening worth studying: which of their pages do engines quote, and on which questions?
6. Citation mix — Where each brand's evidence comes from
For every tracked player, most citations come from third-party sources, from 60.2% (ServiceNow) to 89.4% (Fini). The differences sit in the remaining share:
HubSpot has the largest social share at 17.4%, followed by ServiceNow at 16.1%.
Fini has 0.0% social and 89.4% other sources, with 10.6% from its own domain.
eDesk (1.1% social) and Amazon Web Services (3.2%) rely on their own domains and third-party pages, with almost no social presence.
Intercom (21.3% / 9.4% / 69.2%) and Fin.ai (21.6% / 9.7% / 68.8%) have almost identical mixes.
A near-zero social share is not automatically a problem. But reddit is the highest-volume keyword on the report's search-volume page, so brands with almost no social evidence should at least check whether community discussions mention them, and how.
7. Authority and hygiene — Backlinks and audits measure something else
The backlink ranking looks nothing like the visibility ranking. Microsoft leads with 588.7M backlinks from 2.7M referring domains, and Zendesk follows with 525.8M. Tidio closes the list of ten with 1.5M. Intercom, the visibility leader, is not among the ten domains on the page.
Set against the other pages, the contrast is sharp: Microsoft's visibility is 5.6%, while Tidio holds 9.9% share of voice. HappyFox appears on the backlink page with 4.3M backlinks but not in the ranked scoreboard or the share-of-voice top ten.
The competitive landscape tells a similar story. Most tracked players cluster between roughly 50 and 75 on the technical audit score, yet their visibility scores sit far below Intercom and Fin.ai. Microsoft is the outlier, far to the left on technical readiness.
Across the audited sites, the report counts 336 common issues: 161 missing or invalid structured data (JSON-LD), 75 content readability issues for AI, 41 missing or invalid AI assistant guidelines (llms.txt), 28 AI crawler access issues (robots.txt), 24 content feeds not exposed to AI and 7 page discovery issues.
Similar technical scores produce very different visibility. Hygiene is the entry ticket, not the differentiator.
Fixing structured data and crawler access is cheap and worth doing. It is unlikely, on its own, to explain a 50-point visibility gap.
8. Beyond the leaders — Where nine brands could focus next
The ranked rows from #6 to #18 hold brands with very different situations. Nine of them show a specific result worth investigating.
Early when they appear: Crisp, eDesk and Microsoft
Crisp appears in only 2.5% of answers, but its average Rank is #1.6, the earliest among rows #6–#18. eDesk (6.1% Visibility) and Microsoft (5.6%) both average #1.9. When these brands are included, they tend to come early.
The gap is frequency. For Crisp, the next step is to map the prompts where it already appears and test whether that early position holds on adjacent buyer questions. eDesk has only 9 citations and a 1.1% social share, while its top query is the ecommerce one; checking its presence in ecommerce lists such as help-desk.reviews, a top-cited page, is a concrete place to start. Microsoft surfaces on the public-sector query and has the most backlinks in the report, but sits furthest left on technical readiness. The audit issues on the pages AI engines read are the obvious first check.
One engine, real traction: Fini and Zoho Desk
Fini reaches 20.0% on Claude and 0.0% on ChatGPT. Its domain, usefini.com, is the sixth most-cited source in the report. That is a real strength on one engine and a clear question on another. Fini shares its ecommerce top query with Fin.ai and eDesk, so testing that exact query on ChatGPT is the natural next step.
Zoho Desk has 13.1% Visibility, more than ServiceNow (8.6%) on the podium. It is strongest on Claude (24.0%) and ChatGPT (16.0%) and weakest on Google AI (4.2%). The Google AI gap is the specific thing to investigate: which pages Google AI cites for the small-business query Zoho Desk shares with Help Scout.
Name demand, thin AI presence: Genesys and Kustomer
"genesys" is the second-highest keyword on the search-volume page at 190.3K, yet Genesys holds 4.0% Visibility, 0.1% SoV and an average Rank of #3.0. "kustomer" carries 2.9K, while Kustomer sits at 1.5% Visibility.
Search demand for a name does not translate into a place in category answers. For both, the question is how engines frame them when buyers ask for AI customer support platforms, and whether the brand's own pages describe that use case in the buyer's words.
Present, but late: Sierra and Five9
Sierra has 5.6% Visibility and 30 citations, but an average Rank of #3.2, the latest in the ranked table. Five9 appears in 2.5% of answers at #2.6. Both are cited and included, but tend to appear further down the answer. Reading the specific answers where they appear would show whether they are recommended or listed as alternatives.
9. A 90-day plan — What to test next
Days 1–30: Measure the right things
Track Visibility and Share of Voice separately, per engine. This category proves they disagree.
Identify which of the three buyer intents (small business, ecommerce, public sector) your top query belongs to.
List the top cited "best of" pages for your intent and check whether you are included and described accurately.
Fix the baseline: JSON-LD, AI crawler access in robots.txt and llms.txt.
Days 31–60: Build evidence for one intent
Create or update the page an engine would need to answer your intent: small-business pricing, ecommerce integrations or public-sector compliance (HIPAA, FedRAMP).
Review your profile on G2, the only third-party domain among the top ten sources.
If your social share is near zero, check how community discussions describe your product.
Days 61–90: Re-test where you are closest
Re-run your top query on each engine and compare against your weakest engine.
If your brand runs under more than one name, check which name answers recommend first.
Prioritise the engine where you already have traction over the one where the leaders are strongest.
Want this scoreboard for your own brand? Run a free audit at tryera.ai/free-report — 30 minutes, your numbers, no deck required.
Full report with source data: AI customer support platforms.