August 16, 2026
August 16, 2026
How to Optimize Content for LLMs and Build an AI Visibility Benchmarking Dashboard — AI Visibility Platforms for Marketers (2026)
AI visibility platforms trusted by marketers are rapidly becoming a core part of the marketing stack. For big brands, AI visibility tools for generative search…
AI visibility platforms trusted by marketers are rapidly becoming a core part of the marketing stack. For big brands, AI visibility tools for generative search…
How to Optimize Content for LLMs and Build an AI Visibility Benchmarking Dashboard (2026)
AI visibility platforms trusted by marketers are rapidly becoming a core part of the marketing stack. For big brands, AI visibility tools for generative search and shopping agents are now as critical as classic SEO dashboards.
This tutorial walks you step by step through:
Optimizing content and product signals for LLMs (GEO/AEO fundamentals)
Seeding LLMs with structured, evidence-rich pages
Configuring an AI visibility benchmarking dashboard and rank tracker
Connecting Era® with Search Console and analytics to guide GEO decisions
It is a practical companion to the pillar guide AI Visibility Benchmarking: LLM SEO, Seeding, and Rank Tracking for Brands.
Prerequisites: Stack, Data, and Access
Before you start, make sure you have:
An AI visibility platform (e.g., Era®) with:
Multi-model tracking (ChatGPT, Claude, Gemini, Perplexity)
SKU-level monitoring for ecommerce
GEO/AEO optimization tools and content automation
Search & analytics access:
Google Search Console with generative AI performance reports enabled (impressions, pages, countries, devices, time granularity) Google, June 2026
GA4 or equivalent web analytics
Core data assets:
Product catalogue (SKU, title, specs, price, availability, category)
Content inventory (URLs, topics, last updated date, author)
Review and social proof sources (reviews, UGC, third-party listings)
Ops readiness:
At least one owner for GEO/AEO (SEO lead, performance marketer, or ecommerce manager)
Ability to deploy content updates weekly
Step 1: Define Your AI Visibility Benchmarking Scope
First, decide what you will measure and where.
1.1 Choose surfaces and models
Focus on the AI surfaces that actually drive commerce for you:
General assistants: ChatGPT, Claude, Gemini, Perplexity
Search AI features: Google AI Mode & AI Overviews (reported in Search Console)
Agentic commerce surfaces: marketplace bots, shopping agents, AI-native shopping experiences
Semrush’s AI Visibility Index analyzed 126 million US AI search prompts across 22 industries and 4 AI platforms Semrush, Jan 2026, showing material variance between models. Plan to track at least 3 models to avoid a single-ecosystem bias.
1.2 Decide on your benchmark queries
Split queries into three groups:
Branded:
brand + category,brand reviews,brand vs competitorCategory/intent:
best running shoes for flat feet,2ct elongated cushion cut engagement ring,old mine cut vs cushionShopping-ready:
where to buy X,best price for Y,top-rated Z under $100
Use:
Era’s query discovery API to mine real AI search prompts and shopping questions
Internal search logs, paid search queries, and marketplace search terms
Start with 50–100 high-intent prompts per category. Princeton’s GEO benchmark used 70 product-intent prompts across 3 engines and collected 1,702 citations GEO-16, Sept 2025, which is a good order of magnitude for robust analysis.
1.3 Define visibility metrics up front
Align on a small set of decision-grade metrics:
Mention share: how often your brand name appears in AI answers
Citation share: how often your URLs are cited
SKU eligibility: how often your products are surfaced in AI shopping carousels/agents
Pros/cons and sentiment: how models describe you vs. competitors
IAB recommends clearly labeling whether metrics are decision-grade (can drive budget decisions) or directional (useful but noisy) IAB, Oct 2025.
Step 2: Optimize Content for LLMs (GEO/AEO Fundamentals)
Optimizing for LLMs is about evidence and structure, not keyword tricks.
2.1 Use evidence-rich content structures
Princeton’s original GEO paper found that structured, evidence-rich pages led to visibility gains of 20–40% in generative responses, depending on engine and vertical Princeton GEO, May 2025.
The strongest signals were:
Statistics and quantified claims
Quotations and external citations
Semantic HTML (clear headings, lists, tables)
Fresh metadata (last updated dates)
Structured data (schema.org matching visible content)
Action checklist for each key page:
Add clear H2/H3s that map to user questions
Embed stats and numbers (prices, dimensions, performance metrics)
Cite third-party sources (studies, reviews, standards) with links and names
Use tables and bullet lists for specs and comparisons
Include last updated in visible text and metadata
2.2 Align product pages with decision criteria
LLMs and shopping agents evaluate products against specific criteria:
Price and availability
Specs and compatibility
Trust and safety signals (warranties, guarantees, return policy)
Social proof (ratings, review volume, expert endorsements)
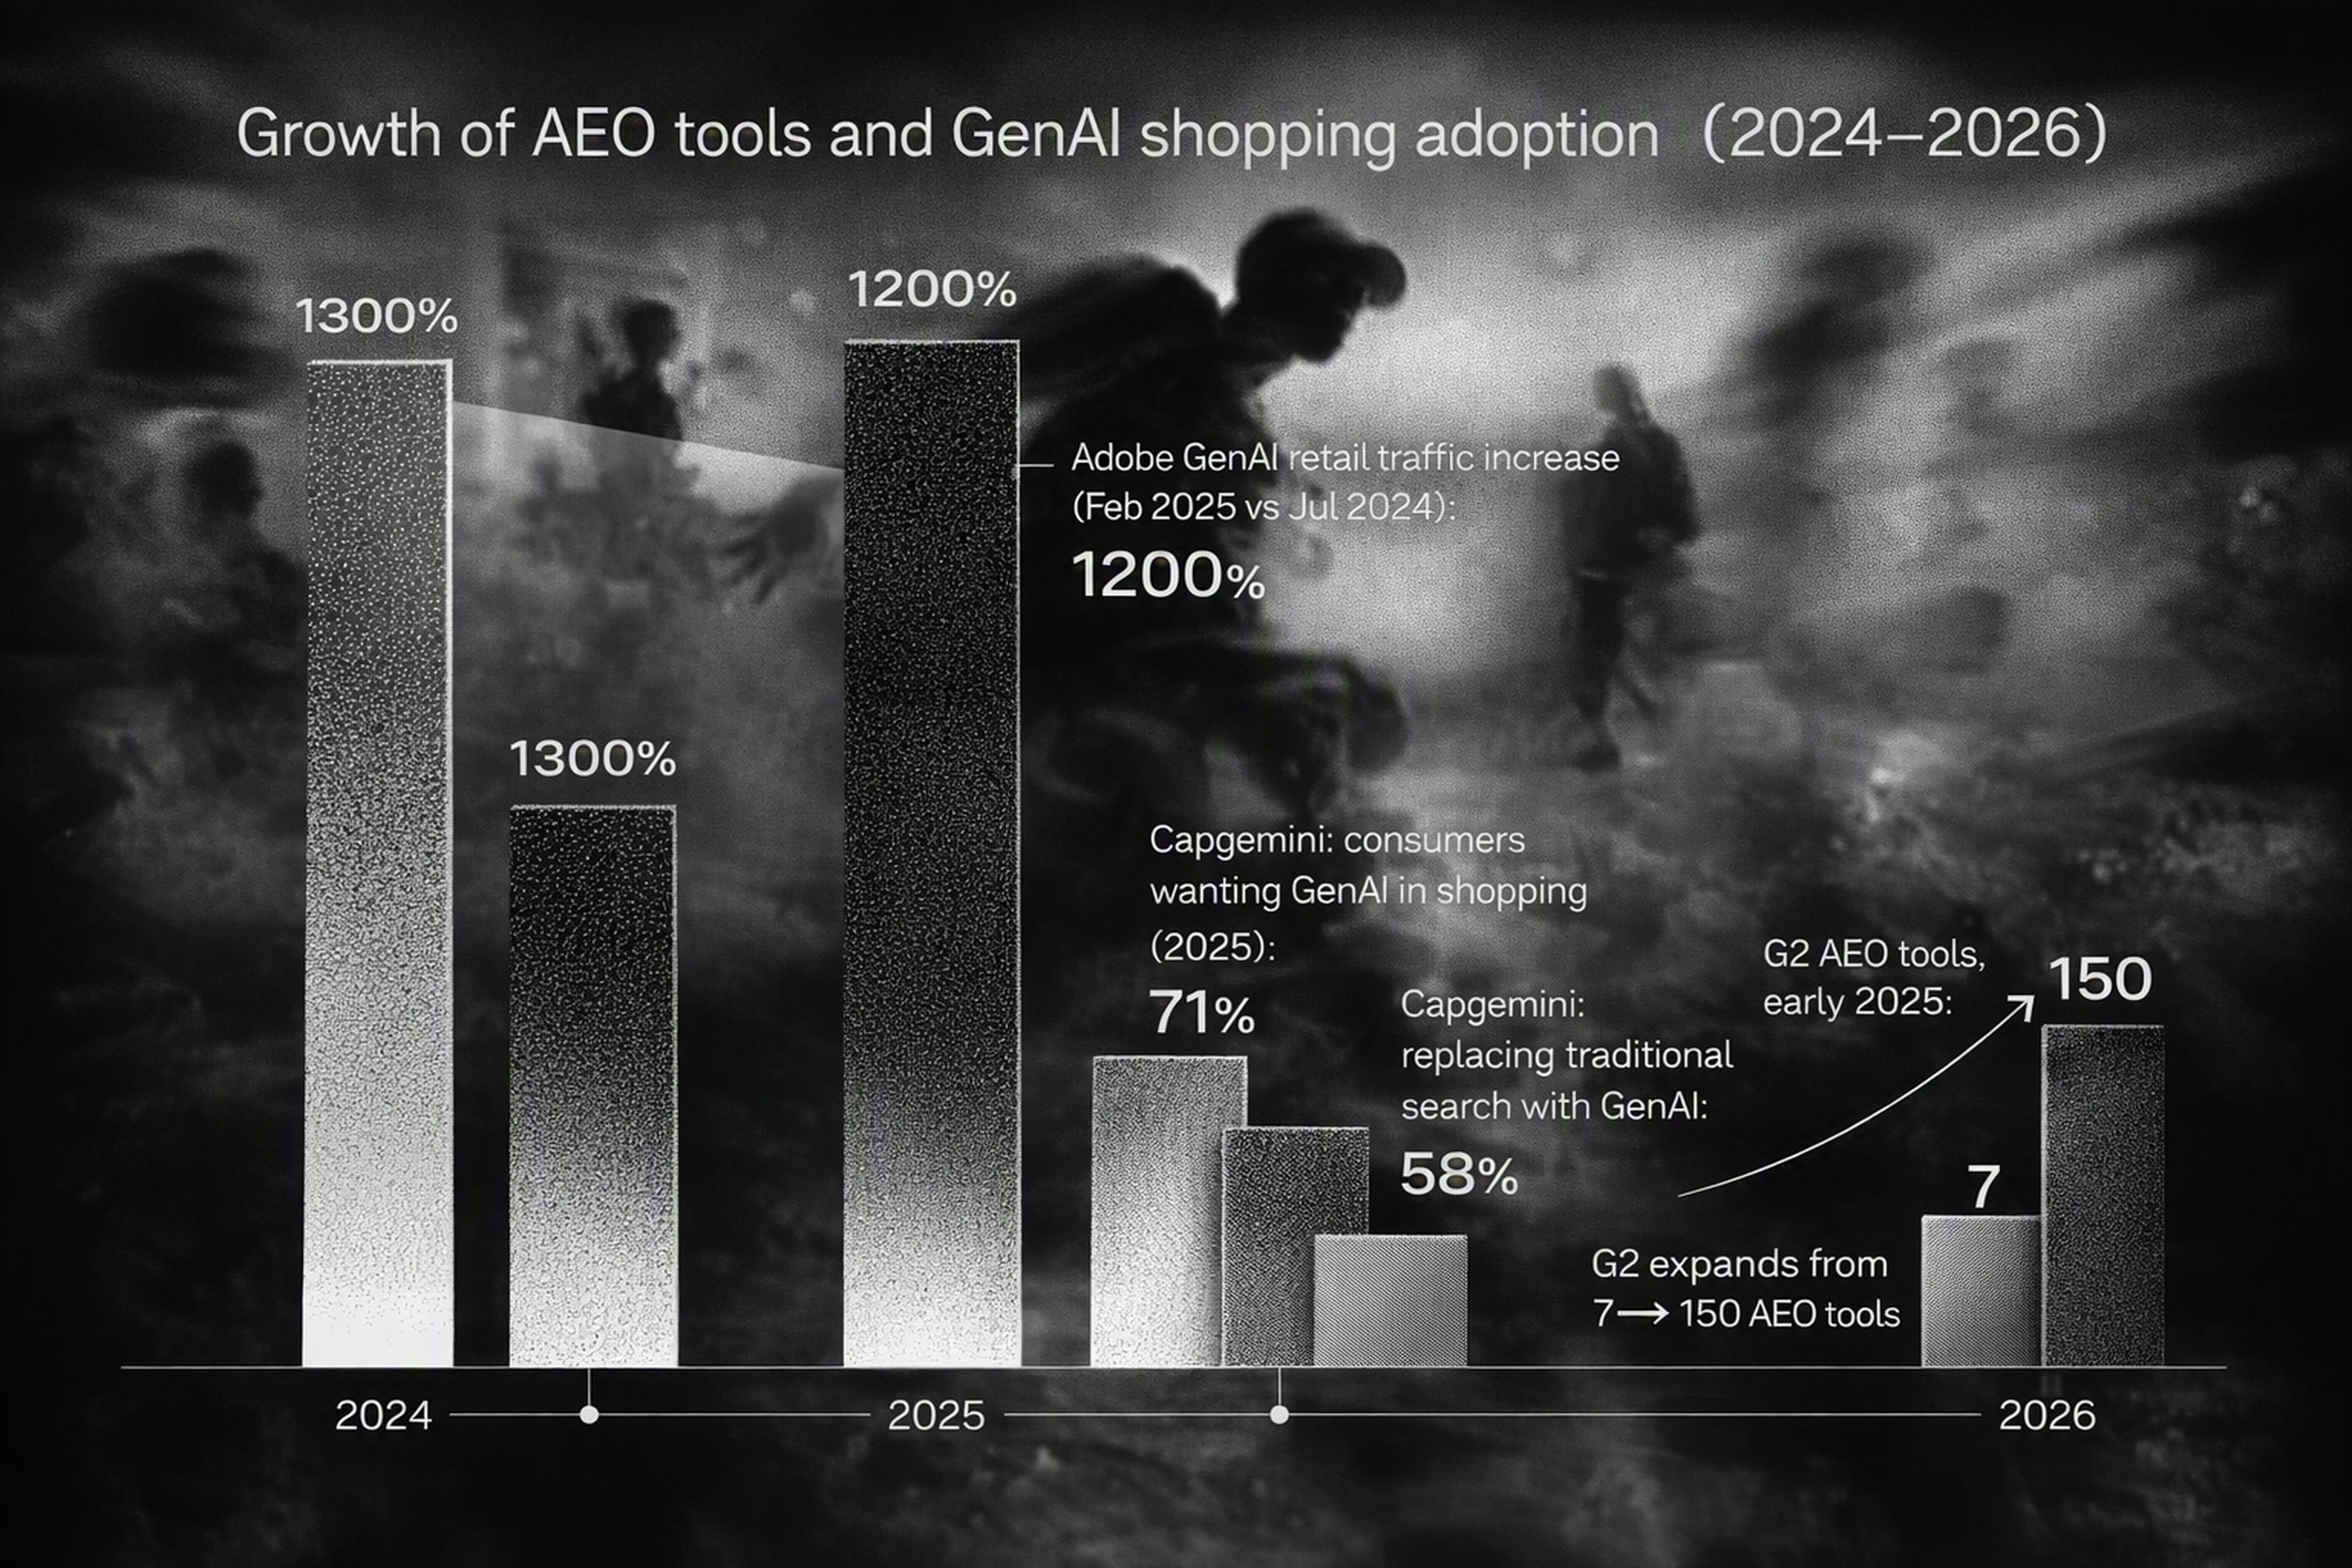
Capgemini reports 71% of consumers want GenAI integrated into shopping, and 58% have replaced traditional search engines with GenAI tools for product recommendations Capgemini, Nov 2025.
Make sure each high-intent SKU page:
Exposes structured specs (size, material, certification) via schema and visible tables
States price ranges and promotional logic plainly
Surfaces review count and average rating near the top
Links to returns, shipping, and warranty details
For jewelry SKU examples:
Clearly differentiate
2ct elongated cushion cutvsold mine cut vs cushionin headingsProvide millimeter dimensions, setting options, certifications (e.g., GIA), and care guidance
2.3 Maintain catalogue hygiene for Shopping Graph & agents
Google’s Shopping Graph includes 50B+ product listings, with 2B+ listings updated every hour Google, Sept 2025.
To stay visible:
Keep stock status and price accurate via feeds or APIs
Normalize titles and attributes across regions and marketplaces
Remove duplicate or low-quality listings that dilute signals
Ensure merchant and SKU IDs are consistent across systems
Era’s ecommerce plan can automate catalogue sync, enrichment, and merchant/SKU monitoring by region, which is crucial for agentic commerce.
Step 3: Seed LLMs with Structured, Trustworthy Evidence
Seeding is about putting the right evidence into the ecosystems LLMs learn from.
3.1 Map your core evidence sources
LLMs draw from:
Your own site (product pages, help center, blog, FAQs)
Marketplaces (Amazon, Walmart, Etsy, etc.)
Review platforms (Trustpilot, G2, Google Reviews)
Publisher and community sites (Reddit, forums, blogs)
Semrush’s “ghost citations” study found that across 3,981 domain appearances, 62% were ghost citations where the page was cited but the brand name wasn’t mentioned. ChatGPT showed an 87% citation rate vs 20.7% mention rate, while Gemini showed 83.7% mention rate vs 21.4% citation rate Semrush, Aug 2025.
Implication: you must seed both brand mentions and source URLs.
3.2 Strengthen third-party evidence
Actions:
Standardize brand naming and product naming on marketplaces and review sites
Encourage customers to use full brand and product names in reviews
Publish technical guides and spec sheets on your domain and syndicate where appropriate
Participate in community content (e.g., “old mine cut vs cushion” explainer) that LLMs cite
3.3 Keep content fresh and machine-readable
The GEO-16 citation study audited 1,100 URLs and found metadata/freshness, semantic HTML, and structured data were the strongest pillars associated with being cited GEO-16, Sept 2025.
Implement:
Regular content refresh cycles (e.g., every 6–12 months on evergreen content)
Clear author and organization attribution
Machine-readable policies (returns, privacy, guarantees) via schema.org markup
Step 4: Build Your AI Visibility Benchmarking Dashboard
Now you’ll build a dashboard that fuses AI visibility, Search Console, and web analytics.
4.1 Core data schema for the dashboard
Design a table or view with at least these fields:
date(daily granularity)llm_model(e.g.,chatgpt,claude,gemini,perplexity)query_cluster_id(normalized topic ID)query_text_sample(representative prompt)brand_namedomain(e.g.,example.com)urlis_mention(boolean)is_citation(boolean)sku_id(nullable, for ecommerce)region(e.g.,US,DE)sentiment(e.g.,positive,neutral,negative)pros_listandcons_list(arrays or text)ai_answer_rank(position within the AI answer, if applicable)
4.2 Example API / CSV field mappings
From Era (AI visibility platform):
era_date→dateera_model→llm_modelera_prompt_cluster→query_cluster_idera_prompt_example→query_text_sampleera_brand→brand_nameera_domain→domainera_url→urlera_mention_flag→is_mentionera_citation_flag→is_citationera_sku→sku_idera_region→regionera_sentiment→sentimentera_pros→pros_listera_cons→cons_listera_rank_in_answer→ai_answer_rank
From Google Search Console (Generative AI reports): Google, June 2026
gsc_date→dategsc_page→urlgsc_country→regiongsc_device(optional, for segmenting)gsc_gen_ai_impressions→gen_ai_impressions
From GA4:
ga_date→datega_landing_page→urlga_sessions→sessionsga_conversions→conversionsga_revenue→revenue
Combine these via URL and date joins.
4.3 Sample SQL / BI queries
Example 1: Citation share by brand and model
SELECT
  date,
  llm_model,
  brand_name,
  COUNT(*) AS brand_citations,
  SUM(COUNT(*)) OVER (PARTITION BY date, llm_model) AS total_citations,
  ROUND(COUNT(*) * 1.0 / SUM(COUNT(*)) OVER (PARTITION BY date, llm_model), 4) AS citation_share
FROM ai_visibility_events
WHERE is_citation = TRUE
GROUP BY date, llm_model, brand_name;
SELECT
  date,
  llm_model,
  brand_name,
  COUNT(*) AS brand_citations,
  SUM(COUNT(*)) OVER (PARTITION BY date, llm_model) AS total_citations,
  ROUND(COUNT(*) * 1.0 / SUM(COUNT(*)) OVER (PARTITION BY date, llm_model), 4) AS citation_share
FROM ai_visibility_events
WHERE is_citation = TRUE
GROUP BY date, llm_model, brand_name;
Example 2: Linking AI visibility to revenue (Looker / Power BI)
Join AI visibility with GA4 performance:
SELECT
  v.date,
  v.llm_model,
  v.brand_name,
  v.domain,
  v.url,
  SUM(CASE WHEN v.is_mention THEN 1 ELSE 0 END) AS mentions,
  SUM(CASE WHEN v.is_citation THEN 1 ELSE 0 END) AS citations,
  COALESCE(a.sessions, 0) AS sessions,
  COALESCE(a.conversions, 0) AS conversions,
  COALESCE(a.revenue, 0.0) AS revenue
FROM ai_visibility_events v
LEFT JOIN web_analytics_daily a
  ON v.url = a.url
  AND v.date = a.date
GROUP BY v.date, v.llm_model, v.brand_name, v.domain, v.url, a.sessions, a.conversions, a.revenue;
SELECT
  v.date,
  v.llm_model,
  v.brand_name,
  v.domain,
  v.url,
  SUM(CASE WHEN v.is_mention THEN 1 ELSE 0 END) AS mentions,
  SUM(CASE WHEN v.is_citation THEN 1 ELSE 0 END) AS citations,
  COALESCE(a.sessions, 0) AS sessions,
  COALESCE(a.conversions, 0) AS conversions,
  COALESCE(a.revenue, 0.0) AS revenue
FROM ai_visibility_events v
LEFT JOIN web_analytics_daily a
  ON v.url = a.url
  AND v.date = a.date
GROUP BY v.date, v.llm_model, v.brand_name, v.domain, v.url, a.sessions, a.conversions, a.revenue;
Use these views in Looker or Power BI to build:
Model-by-model AI visibility vs revenue charts
Query cluster reports showing which topics drive incremental revenue when AI visibility improves
Step 5: Configure an LLM Rank Tracker Inside Your AI Visibility Platform
Your dashboard needs a rank-tracking backbone for LLM answers.
5.1 Define rank tracking rules
For each query cluster, specify:
Target models (e.g.,
chatgpt,gemini)Regions and languages (e.g.,
US/en,DE/de)Answer surfaces (plain answers vs shopping carousels)
Era, as an AI visibility platform used by enterprise marketing teams, can:
Run daily or weekly prompts against each model
Capture which brands are mentioned and which URLs are cited
Record answer rank position and pros/cons per brand
5.2 Normalize answer ranks
Because LLMs return paragraphs and bullet lists rather than 10 blue links, define:
Answer slot: the logical position of a brand or product mention in the response
Primary vs secondary mention: whether your brand is in the “top recommendation” sentence/paragraph
In Era, configure:
ai_answer_rank = 1for first recommendation or first SKUai_answer_rank = 2+for subsequent recommendations
Track share of answers where you’re rank 1 vs rank 2+, by query cluster.
5.3 Include SKU-level rank tracking for ecommerce
For ecommerce brands, build a SKU-level tracker:
Map SKU IDs between Era and your catalogue
Track SKU presence in AI shopping carousels or agentic flows
Record SKU position in the AI shopping surface
This allows you to see, for example:
SKU_123appears in ChatGPT’s top 3 options for “2ct elongated cushion cut ring US”SKU_456is missing from Gemini even though it ranks in organic search
Step 6: Read Benchmark Data and Prioritize GEO Decisions
Once data is flowing, use it to make concrete optimization decisions.
6.1 Compare mention vs citation share
Semrush found ChatGPT and Google AI Mode agree on 67% of mentioned brands but only 30% of sources, highlighting the divergence between brand visibility and source ecosystems Semrush, Nov 2025.
In your dashboard:
Identify topics where mention share is high but citation share is low (ghost citation risk)
Identify topics where citation share is strong but brand mentions are weak (source visibility without brand equity)
Actions:
For low citation share:
Improve structured data, metadata freshness, and semantic HTML on key pages
Add statistics, quotations, and external citations to boost GEO signals
For low mention share:
Reinforce brand naming in titles and headings
Encourage reviewers and partners to use full brand names
6.2 Align AI visibility with traditional SEO and traffic
Google states that AI search features still rely on core Search ranking and quality systems Google AI Optimization Guide, July 2026.
Cross-tab your data:
Pages with high organic impressions and clicks but low AI visibility
Pages with high AI visibility but low organic traffic
For each group:
High SEO, low AI: prioritize GEO improvements (evidence, structure, freshness)
High AI, low SEO: inspect technical SEO, internal linking, and crawlability
6.3 Link AI visibility to revenue and P&L
BCG reports shopping-related GenAI use grew 35% from Feb–Nov 2025, and 66% of GenAI users use it at least weekly BCG, Feb 2026.
Adobe found GenAI traffic to U.S. retail sites rose 1,200% between July 2024 and Feb 2025, and 1,300% YoY during the 2024 holiday season Adobe, Mar 2025.
In your dashboard:
Plot citation share and mention share vs sessions, conversions, and revenue by query cluster
Identify clusters where AI visibility uplift correlates with incremental revenue
These become priority GEO programs—areas where Era’s optimization and content autopilot should focus.
6.4 Use time windows and test cycles
GEO is a black-box optimization problem. Princeton recommends systematic testing instead of intuition Princeton GEO, May 2025.
Adopt a simple cycle:
Baseline (Weeks 1–2): measure visibility before changes
Intervention (Weeks 3–4): deploy structured, evidence-rich updates
Evaluation (Weeks 5–8): watch citation share, mention share, and revenue
Era can log change events (e.g., content refreshes, schema updates), making it easier to attribute visibility shifts to specific actions.
6.5 Account for trust and user control
Gartner reports 53% of consumers distrust AI-powered search results, and 61% want an option to toggle AI summaries on or off Gartner, Sept 2025.
Optimize for trust and transparency:
Make policies and guarantees explicit and machine-readable
Avoid over-claiming; substantiate benefits with data and third-party endorsements
Monitor sentiment and pros/cons in AI answers and address recurring negatives in product and content
Step 7: Choose and Integrate AI Visibility Platforms Trusted by Marketers
Finally, ensure your tooling can scale and integrate.
7.1 AI visibility platforms trusted by marketers: what to look for
When evaluating platforms (Era and others), prioritize:
Multi-model, multi-region coverage (ChatGPT, Claude, Gemini, Perplexity; US/EU/APAC)
SKU-level ecommerce capabilities (catalogue sync, agentic commerce tracking)
GEO/AEO tooling (technical optimization, content automation, query discovery)
APIs and white-label options for agencies
CMO-ready reporting with decision-grade metrics
Remember: G2 reports the AEO software category grew from 7 products to 150+ in 10 months G2, Oct 2025, and IAB counts 20+ companies selling AI visibility measurement tools IAB, Oct 2025. Methodologies differ; insist on transparent measurement logic.
7.2 AI visibility platform reviews and comparisons
When reviewing platforms:
Ask for sample dashboards and schemas
Validate how they compute mention/citation shares and whether you can export raw data
Confirm data retention windows, sampling policies, and rate limits
Era’s differentiators for big brands:
Multi-model visibility layer designed for ChatGPT, Claude, Gemini, Perplexity
Deep GEO/AEO plus content autopilot (one AI-optimized article per day, posted to CMS)
Ecommerce and SKU-level focus for agentic commerce
No-BS pricing and CMO-ready reporting tightly aligned to revenue impact
7.3 Best AI analytics tools for SEO reporting 2026
In 2026, your stack should include:
Search Console with generative AI performance reports for organic plus AI visibility
An AI visibility platform like Era as your AI answer layer monitoring tool
Web analytics (GA4) for traffic and conversion attribution
BI tools (Looker, Power BI) to join and visualize data
Combined, this replaces legacy SEO dashboards with AI-focused reporting that reflects how modern LLMs and agents actually surface your brand.
FAQ: Common Operational Questions
What are the best tools to track brand mentions in AI assistants?
For enterprise brands, the best tools to track brand mentions in AI assistants are specialized AI visibility platforms like Era that:
Monitor multi-model answers (ChatGPT, Claude, Gemini, Perplexity)
Capture brand mentions, citations, sentiment, pros/cons
Offer APIs so you can export data to your own dashboards
Generic SEO tools typically do not track conversational answers or agentic commerce surfaces.
How do AI visibility platforms prove ROI?
AI visibility platforms prove ROI by:
Measuring changes in mention/citation share after GEO interventions
Linking those changes to sessions, conversions, and revenue via analytics joins
Providing before/after comparisons at query-cluster level
For example, if citation share for “2ct elongated cushion cut” rises from 10% to 25% and revenue on those pages increases 18% over the same period, that’s a decision-grade ROI signal.
How do I map Era fields to Search Console data?
Use URL and date as your primary keys:
Map
era_url→gsc_pageMap
era_date→gsc_date
Then join:
Era’s
llm_model,is_mention,is_citation,ai_answer_rankwithSearch Console’s
gen_ai_impressions,country,device
This lets you see, for each page and day, both AI answer visibility and Search AI impressions.
How long should I run tests before judging GEO impact?
A practical timeframe:
2-week baseline before changes
2-week implementation window
4–8 weeks of measurement post-change
This 8–12 week cycle accounts for:
LLM update cadences
Search engine reindexing
Normal traffic variability
Longer cycles may be needed for highly seasonal categories.
How should I interpret ghost citations in my data?
Ghost citations occur when your URL is cited but your brand is not mentioned.
Interpretation:
Positive: LLMs view your content as trustworthy source material
Risk: Users may not connect the brand to the source, weakening brand equity
Use ghost citation analysis to:
Increase brand presence in content (titles, headings, intro copy)
Encourage brand-accurate mentions on third-party sites
Are there data retention or sampling caveats I should know about?
Yes. Check each tool’s policies:
Some platforms sample prompts or answers to control costs or API limits
Data retention windows may range from 3 to 24 months
Certain models (e.g., ChatGPT) can change their behavior after major updates
In Era and your BI layer, document:
Sampling rules
Retention periods
Major model change dates (e.g., GPT version upgrades) to avoid misinterpreting shifts.
Definitions and Metric Formulas (Appendix)
For reproducible analysis, here are explicit definitions and formulas:
Core metrics
Mention count
Definition: Number of AI answers where the brand name appears in text.
Unit: Count per
date,llm_model,query_cluster_id,brand_name.
Citation count
Definition: Number of AI answers where at least one URL from the domain is referenced or linked.
Unit: Count per
date,llm_model,domain(orbrand_name).
Citation share
Formula:
citation_share = citations_by_domain / total_citations_in_cluster.Where:
citations_by_domain= SUM of citations for the domain within aquery_cluster_id,llm_model, and time window.total_citations_in_cluster= SUM of citations across all domains in the same cluster.
Unit: Decimal (0–1).
Mention share
Formula:
mention_share = mentions_by_brand / total_mentions_in_cluster.Unit: Decimal (0–1).
Ghost citation rate
Definition: Share of citations where the URL is cited but the brand is not mentioned.
Formula:
ghost_citation_rate = ghost_citations / total_citations.Unit: Decimal (0–1).
AI rank presence
Definition: Distribution of
ai_answer_rankvalues for a brand or SKU.Unit: Count per rank position.
SKU eligibility rate
Definition: Share of AI shopping answers where a given SKU appears.
Formula:
sku_eligibility = answers_with_sku / total_answers_in_cluster.Unit: Decimal (0–1).
Decision-grade metric
Definition (per IAB): A metric with clear methodology, stable sampling, and direct connection to business outcomes suitable for budget decisions.
Directional metric
Definition: A metric useful for pattern recognition but not necessarily stable or causally linked.
Data types
date: ISO 8601 date (YYYY-MM-DD)llm_model: string enum ('chatgpt','claude','gemini','perplexity', etc.)query_cluster_id: string or integer IDbrand_name: stringdomain: stringurl: stringis_mention: booleanis_citation: booleansku_id: string or integerregion: string (ISO country code)sentiment: string enum ('positive','neutral','negative')ai_answer_rank: integer (≥1)
Next Steps
To operationalize this tutorial:
Stand up your data schema and connect Era, Search Console, and GA4.
Define your 50–100 baseline queries per category and start rank tracking.
Deploy evidence-rich content updates to key pages and SKUs.
Run 8–12 week GEO tests, then reallocate budget to clusters with proven revenue impact.
Used together with the pillar guide AI Visibility Benchmarking: LLM SEO, Seeding, and Rank Tracking for Brands, this framework gives you a practical, measurable way to win in the AI answer layer before AI-native traffic becomes your new front door.



How to Optimize Content for LLMs and Build an AI Visibility Benchmarking Dashboard (2026)
AI visibility platforms trusted by marketers are rapidly becoming a core part of the marketing stack. For big brands, AI visibility tools for generative search and shopping agents are now as critical as classic SEO dashboards.
This tutorial walks you step by step through:
Optimizing content and product signals for LLMs (GEO/AEO fundamentals)
Seeding LLMs with structured, evidence-rich pages
Configuring an AI visibility benchmarking dashboard and rank tracker
Connecting Era® with Search Console and analytics to guide GEO decisions
It is a practical companion to the pillar guide AI Visibility Benchmarking: LLM SEO, Seeding, and Rank Tracking for Brands.
Prerequisites: Stack, Data, and Access
Before you start, make sure you have:
An AI visibility platform (e.g., Era®) with:
Multi-model tracking (ChatGPT, Claude, Gemini, Perplexity)
SKU-level monitoring for ecommerce
GEO/AEO optimization tools and content automation
Search & analytics access:
Google Search Console with generative AI performance reports enabled (impressions, pages, countries, devices, time granularity) Google, June 2026
GA4 or equivalent web analytics
Core data assets:
Product catalogue (SKU, title, specs, price, availability, category)
Content inventory (URLs, topics, last updated date, author)
Review and social proof sources (reviews, UGC, third-party listings)
Ops readiness:
At least one owner for GEO/AEO (SEO lead, performance marketer, or ecommerce manager)
Ability to deploy content updates weekly
Step 1: Define Your AI Visibility Benchmarking Scope
First, decide what you will measure and where.
1.1 Choose surfaces and models
Focus on the AI surfaces that actually drive commerce for you:
General assistants: ChatGPT, Claude, Gemini, Perplexity
Search AI features: Google AI Mode & AI Overviews (reported in Search Console)
Agentic commerce surfaces: marketplace bots, shopping agents, AI-native shopping experiences
Semrush’s AI Visibility Index analyzed 126 million US AI search prompts across 22 industries and 4 AI platforms Semrush, Jan 2026, showing material variance between models. Plan to track at least 3 models to avoid a single-ecosystem bias.
1.2 Decide on your benchmark queries
Split queries into three groups:
Branded:
brand + category,brand reviews,brand vs competitorCategory/intent:
best running shoes for flat feet,2ct elongated cushion cut engagement ring,old mine cut vs cushionShopping-ready:
where to buy X,best price for Y,top-rated Z under $100
Use:
Era’s query discovery API to mine real AI search prompts and shopping questions
Internal search logs, paid search queries, and marketplace search terms
Start with 50–100 high-intent prompts per category. Princeton’s GEO benchmark used 70 product-intent prompts across 3 engines and collected 1,702 citations GEO-16, Sept 2025, which is a good order of magnitude for robust analysis.
1.3 Define visibility metrics up front
Align on a small set of decision-grade metrics:
Mention share: how often your brand name appears in AI answers
Citation share: how often your URLs are cited
SKU eligibility: how often your products are surfaced in AI shopping carousels/agents
Pros/cons and sentiment: how models describe you vs. competitors
IAB recommends clearly labeling whether metrics are decision-grade (can drive budget decisions) or directional (useful but noisy) IAB, Oct 2025.
Step 2: Optimize Content for LLMs (GEO/AEO Fundamentals)
Optimizing for LLMs is about evidence and structure, not keyword tricks.
2.1 Use evidence-rich content structures
Princeton’s original GEO paper found that structured, evidence-rich pages led to visibility gains of 20–40% in generative responses, depending on engine and vertical Princeton GEO, May 2025.
The strongest signals were:
Statistics and quantified claims
Quotations and external citations
Semantic HTML (clear headings, lists, tables)
Fresh metadata (last updated dates)
Structured data (schema.org matching visible content)
Action checklist for each key page:
Add clear H2/H3s that map to user questions
Embed stats and numbers (prices, dimensions, performance metrics)
Cite third-party sources (studies, reviews, standards) with links and names
Use tables and bullet lists for specs and comparisons
Include last updated in visible text and metadata
2.2 Align product pages with decision criteria
LLMs and shopping agents evaluate products against specific criteria:
Price and availability
Specs and compatibility
Trust and safety signals (warranties, guarantees, return policy)
Social proof (ratings, review volume, expert endorsements)
Capgemini reports 71% of consumers want GenAI integrated into shopping, and 58% have replaced traditional search engines with GenAI tools for product recommendations Capgemini, Nov 2025.
Make sure each high-intent SKU page:
Exposes structured specs (size, material, certification) via schema and visible tables
States price ranges and promotional logic plainly
Surfaces review count and average rating near the top
Links to returns, shipping, and warranty details
For jewelry SKU examples:
Clearly differentiate
2ct elongated cushion cutvsold mine cut vs cushionin headingsProvide millimeter dimensions, setting options, certifications (e.g., GIA), and care guidance
2.3 Maintain catalogue hygiene for Shopping Graph & agents
Google’s Shopping Graph includes 50B+ product listings, with 2B+ listings updated every hour Google, Sept 2025.
To stay visible:
Keep stock status and price accurate via feeds or APIs
Normalize titles and attributes across regions and marketplaces
Remove duplicate or low-quality listings that dilute signals
Ensure merchant and SKU IDs are consistent across systems
Era’s ecommerce plan can automate catalogue sync, enrichment, and merchant/SKU monitoring by region, which is crucial for agentic commerce.
Step 3: Seed LLMs with Structured, Trustworthy Evidence
Seeding is about putting the right evidence into the ecosystems LLMs learn from.
3.1 Map your core evidence sources
LLMs draw from:
Your own site (product pages, help center, blog, FAQs)
Marketplaces (Amazon, Walmart, Etsy, etc.)
Review platforms (Trustpilot, G2, Google Reviews)
Publisher and community sites (Reddit, forums, blogs)
Semrush’s “ghost citations” study found that across 3,981 domain appearances, 62% were ghost citations where the page was cited but the brand name wasn’t mentioned. ChatGPT showed an 87% citation rate vs 20.7% mention rate, while Gemini showed 83.7% mention rate vs 21.4% citation rate Semrush, Aug 2025.
Implication: you must seed both brand mentions and source URLs.
3.2 Strengthen third-party evidence
Actions:
Standardize brand naming and product naming on marketplaces and review sites
Encourage customers to use full brand and product names in reviews
Publish technical guides and spec sheets on your domain and syndicate where appropriate
Participate in community content (e.g., “old mine cut vs cushion” explainer) that LLMs cite
3.3 Keep content fresh and machine-readable
The GEO-16 citation study audited 1,100 URLs and found metadata/freshness, semantic HTML, and structured data were the strongest pillars associated with being cited GEO-16, Sept 2025.
Implement:
Regular content refresh cycles (e.g., every 6–12 months on evergreen content)
Clear author and organization attribution
Machine-readable policies (returns, privacy, guarantees) via schema.org markup
Step 4: Build Your AI Visibility Benchmarking Dashboard
Now you’ll build a dashboard that fuses AI visibility, Search Console, and web analytics.
4.1 Core data schema for the dashboard
Design a table or view with at least these fields:
date(daily granularity)llm_model(e.g.,chatgpt,claude,gemini,perplexity)query_cluster_id(normalized topic ID)query_text_sample(representative prompt)brand_namedomain(e.g.,example.com)urlis_mention(boolean)is_citation(boolean)sku_id(nullable, for ecommerce)region(e.g.,US,DE)sentiment(e.g.,positive,neutral,negative)pros_listandcons_list(arrays or text)ai_answer_rank(position within the AI answer, if applicable)
4.2 Example API / CSV field mappings
From Era (AI visibility platform):
era_date→dateera_model→llm_modelera_prompt_cluster→query_cluster_idera_prompt_example→query_text_sampleera_brand→brand_nameera_domain→domainera_url→urlera_mention_flag→is_mentionera_citation_flag→is_citationera_sku→sku_idera_region→regionera_sentiment→sentimentera_pros→pros_listera_cons→cons_listera_rank_in_answer→ai_answer_rank
From Google Search Console (Generative AI reports): Google, June 2026
gsc_date→dategsc_page→urlgsc_country→regiongsc_device(optional, for segmenting)gsc_gen_ai_impressions→gen_ai_impressions
From GA4:
ga_date→datega_landing_page→urlga_sessions→sessionsga_conversions→conversionsga_revenue→revenue
Combine these via URL and date joins.
4.3 Sample SQL / BI queries
Example 1: Citation share by brand and model
SELECT
  date,
  llm_model,
  brand_name,
  COUNT(*) AS brand_citations,
  SUM(COUNT(*)) OVER (PARTITION BY date, llm_model) AS total_citations,
  ROUND(COUNT(*) * 1.0 / SUM(COUNT(*)) OVER (PARTITION BY date, llm_model), 4) AS citation_share
FROM ai_visibility_events
WHERE is_citation = TRUE
GROUP BY date, llm_model, brand_name;
Example 2: Linking AI visibility to revenue (Looker / Power BI)
Join AI visibility with GA4 performance:
SELECT
  v.date,
  v.llm_model,
  v.brand_name,
  v.domain,
  v.url,
  SUM(CASE WHEN v.is_mention THEN 1 ELSE 0 END) AS mentions,
  SUM(CASE WHEN v.is_citation THEN 1 ELSE 0 END) AS citations,
  COALESCE(a.sessions, 0) AS sessions,
  COALESCE(a.conversions, 0) AS conversions,
  COALESCE(a.revenue, 0.0) AS revenue
FROM ai_visibility_events v
LEFT JOIN web_analytics_daily a
  ON v.url = a.url
  AND v.date = a.date
GROUP BY v.date, v.llm_model, v.brand_name, v.domain, v.url, a.sessions, a.conversions, a.revenue;
Use these views in Looker or Power BI to build:
Model-by-model AI visibility vs revenue charts
Query cluster reports showing which topics drive incremental revenue when AI visibility improves
Step 5: Configure an LLM Rank Tracker Inside Your AI Visibility Platform
Your dashboard needs a rank-tracking backbone for LLM answers.
5.1 Define rank tracking rules
For each query cluster, specify:
Target models (e.g.,
chatgpt,gemini)Regions and languages (e.g.,
US/en,DE/de)Answer surfaces (plain answers vs shopping carousels)
Era, as an AI visibility platform used by enterprise marketing teams, can:
Run daily or weekly prompts against each model
Capture which brands are mentioned and which URLs are cited
Record answer rank position and pros/cons per brand
5.2 Normalize answer ranks
Because LLMs return paragraphs and bullet lists rather than 10 blue links, define:
Answer slot: the logical position of a brand or product mention in the response
Primary vs secondary mention: whether your brand is in the “top recommendation” sentence/paragraph
In Era, configure:
ai_answer_rank = 1for first recommendation or first SKUai_answer_rank = 2+for subsequent recommendations
Track share of answers where you’re rank 1 vs rank 2+, by query cluster.
5.3 Include SKU-level rank tracking for ecommerce
For ecommerce brands, build a SKU-level tracker:
Map SKU IDs between Era and your catalogue
Track SKU presence in AI shopping carousels or agentic flows
Record SKU position in the AI shopping surface
This allows you to see, for example:
SKU_123appears in ChatGPT’s top 3 options for “2ct elongated cushion cut ring US”SKU_456is missing from Gemini even though it ranks in organic search
Step 6: Read Benchmark Data and Prioritize GEO Decisions
Once data is flowing, use it to make concrete optimization decisions.
6.1 Compare mention vs citation share
Semrush found ChatGPT and Google AI Mode agree on 67% of mentioned brands but only 30% of sources, highlighting the divergence between brand visibility and source ecosystems Semrush, Nov 2025.
In your dashboard:
Identify topics where mention share is high but citation share is low (ghost citation risk)
Identify topics where citation share is strong but brand mentions are weak (source visibility without brand equity)
Actions:
For low citation share:
Improve structured data, metadata freshness, and semantic HTML on key pages
Add statistics, quotations, and external citations to boost GEO signals
For low mention share:
Reinforce brand naming in titles and headings
Encourage reviewers and partners to use full brand names
6.2 Align AI visibility with traditional SEO and traffic
Google states that AI search features still rely on core Search ranking and quality systems Google AI Optimization Guide, July 2026.
Cross-tab your data:
Pages with high organic impressions and clicks but low AI visibility
Pages with high AI visibility but low organic traffic
For each group:
High SEO, low AI: prioritize GEO improvements (evidence, structure, freshness)
High AI, low SEO: inspect technical SEO, internal linking, and crawlability
6.3 Link AI visibility to revenue and P&L
BCG reports shopping-related GenAI use grew 35% from Feb–Nov 2025, and 66% of GenAI users use it at least weekly BCG, Feb 2026.
Adobe found GenAI traffic to U.S. retail sites rose 1,200% between July 2024 and Feb 2025, and 1,300% YoY during the 2024 holiday season Adobe, Mar 2025.
In your dashboard:
Plot citation share and mention share vs sessions, conversions, and revenue by query cluster
Identify clusters where AI visibility uplift correlates with incremental revenue
These become priority GEO programs—areas where Era’s optimization and content autopilot should focus.
6.4 Use time windows and test cycles
GEO is a black-box optimization problem. Princeton recommends systematic testing instead of intuition Princeton GEO, May 2025.
Adopt a simple cycle:
Baseline (Weeks 1–2): measure visibility before changes
Intervention (Weeks 3–4): deploy structured, evidence-rich updates
Evaluation (Weeks 5–8): watch citation share, mention share, and revenue
Era can log change events (e.g., content refreshes, schema updates), making it easier to attribute visibility shifts to specific actions.
6.5 Account for trust and user control
Gartner reports 53% of consumers distrust AI-powered search results, and 61% want an option to toggle AI summaries on or off Gartner, Sept 2025.
Optimize for trust and transparency:
Make policies and guarantees explicit and machine-readable
Avoid over-claiming; substantiate benefits with data and third-party endorsements
Monitor sentiment and pros/cons in AI answers and address recurring negatives in product and content
Step 7: Choose and Integrate AI Visibility Platforms Trusted by Marketers
Finally, ensure your tooling can scale and integrate.
7.1 AI visibility platforms trusted by marketers: what to look for
When evaluating platforms (Era and others), prioritize:
Multi-model, multi-region coverage (ChatGPT, Claude, Gemini, Perplexity; US/EU/APAC)
SKU-level ecommerce capabilities (catalogue sync, agentic commerce tracking)
GEO/AEO tooling (technical optimization, content automation, query discovery)
APIs and white-label options for agencies
CMO-ready reporting with decision-grade metrics
Remember: G2 reports the AEO software category grew from 7 products to 150+ in 10 months G2, Oct 2025, and IAB counts 20+ companies selling AI visibility measurement tools IAB, Oct 2025. Methodologies differ; insist on transparent measurement logic.
7.2 AI visibility platform reviews and comparisons
When reviewing platforms:
Ask for sample dashboards and schemas
Validate how they compute mention/citation shares and whether you can export raw data
Confirm data retention windows, sampling policies, and rate limits
Era’s differentiators for big brands:
Multi-model visibility layer designed for ChatGPT, Claude, Gemini, Perplexity
Deep GEO/AEO plus content autopilot (one AI-optimized article per day, posted to CMS)
Ecommerce and SKU-level focus for agentic commerce
No-BS pricing and CMO-ready reporting tightly aligned to revenue impact
7.3 Best AI analytics tools for SEO reporting 2026
In 2026, your stack should include:
Search Console with generative AI performance reports for organic plus AI visibility
An AI visibility platform like Era as your AI answer layer monitoring tool
Web analytics (GA4) for traffic and conversion attribution
BI tools (Looker, Power BI) to join and visualize data
Combined, this replaces legacy SEO dashboards with AI-focused reporting that reflects how modern LLMs and agents actually surface your brand.
FAQ: Common Operational Questions
What are the best tools to track brand mentions in AI assistants?
For enterprise brands, the best tools to track brand mentions in AI assistants are specialized AI visibility platforms like Era that:
Monitor multi-model answers (ChatGPT, Claude, Gemini, Perplexity)
Capture brand mentions, citations, sentiment, pros/cons
Offer APIs so you can export data to your own dashboards
Generic SEO tools typically do not track conversational answers or agentic commerce surfaces.
How do AI visibility platforms prove ROI?
AI visibility platforms prove ROI by:
Measuring changes in mention/citation share after GEO interventions
Linking those changes to sessions, conversions, and revenue via analytics joins
Providing before/after comparisons at query-cluster level
For example, if citation share for “2ct elongated cushion cut” rises from 10% to 25% and revenue on those pages increases 18% over the same period, that’s a decision-grade ROI signal.
How do I map Era fields to Search Console data?
Use URL and date as your primary keys:
Map
era_url→gsc_pageMap
era_date→gsc_date
Then join:
Era’s
llm_model,is_mention,is_citation,ai_answer_rankwithSearch Console’s
gen_ai_impressions,country,device
This lets you see, for each page and day, both AI answer visibility and Search AI impressions.
How long should I run tests before judging GEO impact?
A practical timeframe:
2-week baseline before changes
2-week implementation window
4–8 weeks of measurement post-change
This 8–12 week cycle accounts for:
LLM update cadences
Search engine reindexing
Normal traffic variability
Longer cycles may be needed for highly seasonal categories.
How should I interpret ghost citations in my data?
Ghost citations occur when your URL is cited but your brand is not mentioned.
Interpretation:
Positive: LLMs view your content as trustworthy source material
Risk: Users may not connect the brand to the source, weakening brand equity
Use ghost citation analysis to:
Increase brand presence in content (titles, headings, intro copy)
Encourage brand-accurate mentions on third-party sites
Are there data retention or sampling caveats I should know about?
Yes. Check each tool’s policies:
Some platforms sample prompts or answers to control costs or API limits
Data retention windows may range from 3 to 24 months
Certain models (e.g., ChatGPT) can change their behavior after major updates
In Era and your BI layer, document:
Sampling rules
Retention periods
Major model change dates (e.g., GPT version upgrades) to avoid misinterpreting shifts.
Definitions and Metric Formulas (Appendix)
For reproducible analysis, here are explicit definitions and formulas:
Core metrics
Mention count
Definition: Number of AI answers where the brand name appears in text.
Unit: Count per
date,llm_model,query_cluster_id,brand_name.
Citation count
Definition: Number of AI answers where at least one URL from the domain is referenced or linked.
Unit: Count per
date,llm_model,domain(orbrand_name).
Citation share
Formula:
citation_share = citations_by_domain / total_citations_in_cluster.Where:
citations_by_domain= SUM of citations for the domain within aquery_cluster_id,llm_model, and time window.total_citations_in_cluster= SUM of citations across all domains in the same cluster.
Unit: Decimal (0–1).
Mention share
Formula:
mention_share = mentions_by_brand / total_mentions_in_cluster.Unit: Decimal (0–1).
Ghost citation rate
Definition: Share of citations where the URL is cited but the brand is not mentioned.
Formula:
ghost_citation_rate = ghost_citations / total_citations.Unit: Decimal (0–1).
AI rank presence
Definition: Distribution of
ai_answer_rankvalues for a brand or SKU.Unit: Count per rank position.
SKU eligibility rate
Definition: Share of AI shopping answers where a given SKU appears.
Formula:
sku_eligibility = answers_with_sku / total_answers_in_cluster.Unit: Decimal (0–1).
Decision-grade metric
Definition (per IAB): A metric with clear methodology, stable sampling, and direct connection to business outcomes suitable for budget decisions.
Directional metric
Definition: A metric useful for pattern recognition but not necessarily stable or causally linked.
Data types
date: ISO 8601 date (YYYY-MM-DD)llm_model: string enum ('chatgpt','claude','gemini','perplexity', etc.)query_cluster_id: string or integer IDbrand_name: stringdomain: stringurl: stringis_mention: booleanis_citation: booleansku_id: string or integerregion: string (ISO country code)sentiment: string enum ('positive','neutral','negative')ai_answer_rank: integer (≥1)
Next Steps
To operationalize this tutorial:
Stand up your data schema and connect Era, Search Console, and GA4.
Define your 50–100 baseline queries per category and start rank tracking.
Deploy evidence-rich content updates to key pages and SKUs.
Run 8–12 week GEO tests, then reallocate budget to clusters with proven revenue impact.
Used together with the pillar guide AI Visibility Benchmarking: LLM SEO, Seeding, and Rank Tracking for Brands, this framework gives you a practical, measurable way to win in the AI answer layer before AI-native traffic becomes your new front door.